. 2016 Jan;37(1):66-73.
doi: 10.3174/ajnr.A4493. Epub 2015 Oct 22.

Improved Brain Tumor Classification by Sodium MR Imaging: Prediction of IDH Mutation Status and Tumor Progression

Affiliations

Improved Brain Tumor Classification by Sodium MR Imaging: Prediction of IDH Mutation Status and Tumor Progression

A Biller et al. AJNR Am J Neuroradiol. 2016 Jan.

Abstract

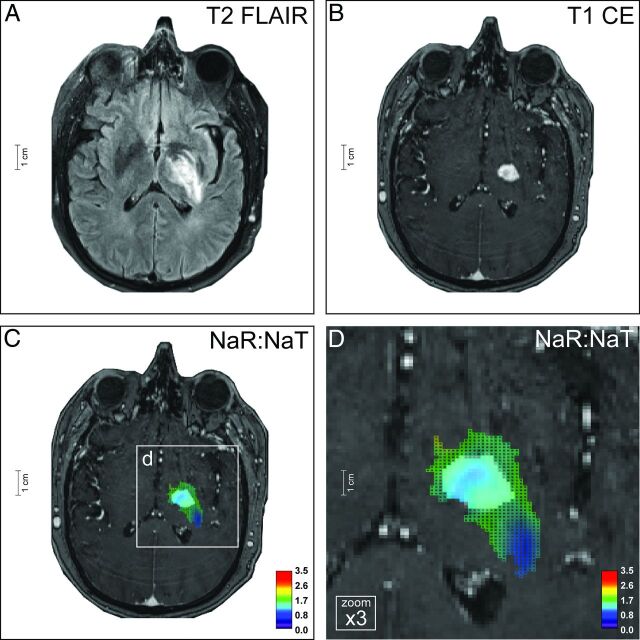
Background and purpose: MR imaging in neuro-oncology is challenging due to inherent ambiguities in proton signal behavior. Sodium-MR imaging may substantially contribute to the characterization of tumors because it reflects the functional status of the sodium-potassium pump and sodium channels.

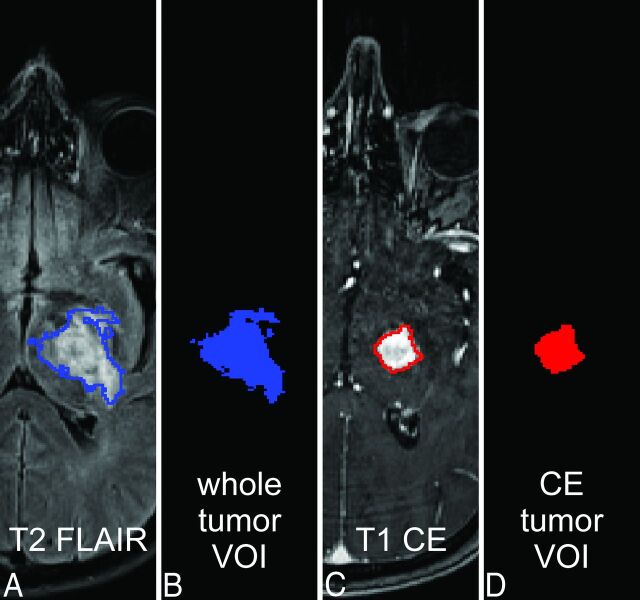
Materials and methods: Sodium-MR imaging data of patients with treatment-naïve glioma WHO grades I-IV (n = 34; mean age, 51.29 ± 17.77 years) were acquired by using a 7T MR system. For acquisition of sodium-MR images, we applied density-adapted 3D radial projection reconstruction pulse sequences. Proton-MR imaging data were acquired by using a 3T whole-body system.

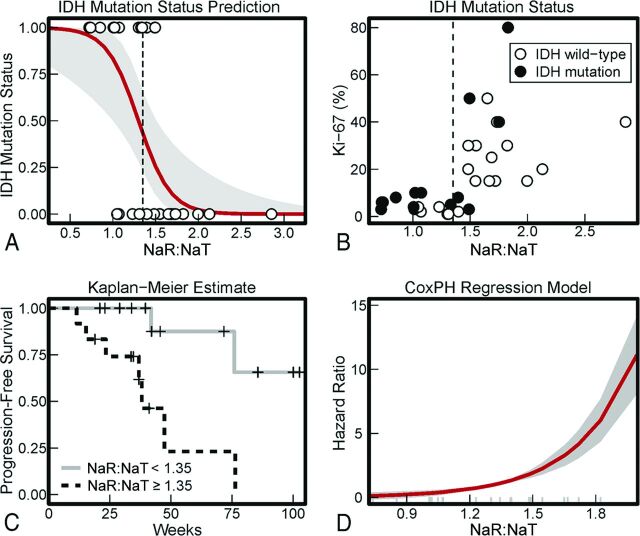
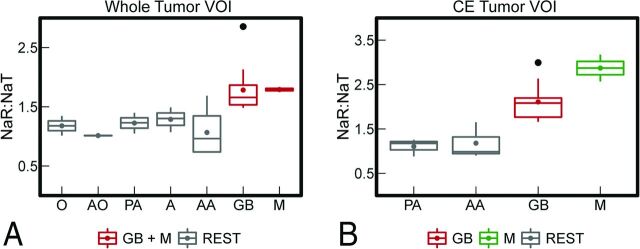
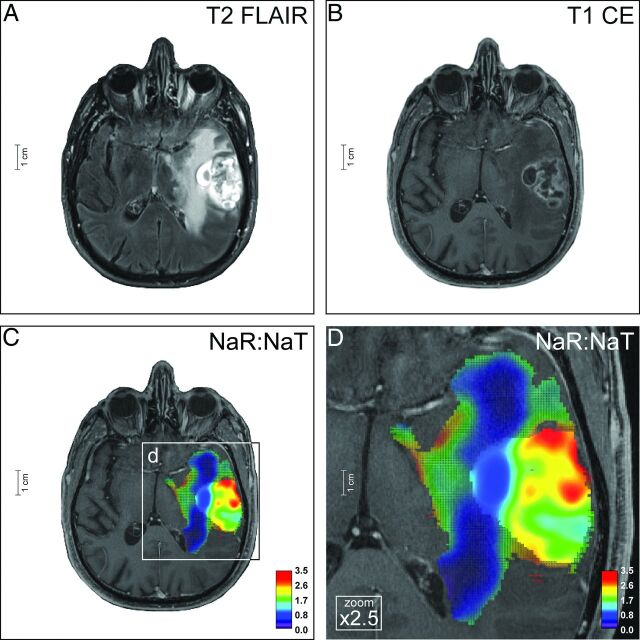
Results: We demonstrated that the initial sodium signal of a treatment-naïve brain tumor is a significant predictor of isocitrate dehydrogenase (IDH) mutation status (P < .001). Moreover, independent of this correlation, the Cox proportional hazards model confirmed the sodium signal of treatment-naïve brain tumors as a predictor of progression (P = .003). Compared with the molecular signature of IDH mutation status, information criteria of model comparison revealed that the sodium signal is even superior to IDH in progression prediction. In addition, sodium-MR imaging provides a new approach to noninvasive tumor classification. The sodium signal of contrast-enhancing tumor portions facilitates differentiation among most glioma types (P < .001).

Conclusions: The information of sodium-MR imaging may help to classify neoplasias at an early stage, to reduce invasive tissue characterization such as stereotactic biopsy specimens, and overall to promote improved and individualized patient management in neuro-oncology by novel imaging signatures of brain tumors.


Figures

Fig 1.
Fig 1.
Tumor masking. The T2 signal of tumor and perifocal edema is shown on an exemplary T2-FLAIR image (A) of a patient with GG (ID no. 2, On-line Table 1); it is the basis of the whole tumor VOI (A and B, blue). CE tumor portions (C) define the CE tumor VOI (C and D, red). All tumor VOIs were created by using ilastik (see Materials and Methods; Image Processing; and On-line Appendix, Methods).
Fig 2.
Fig 2.
A, Prediction of IDH mutation status from NaR:NaT. Each circular marker indicates 1 tumor's mean NaR:NaT value and its IDH mutation status. These values were entered into a logistic regression model, and the resulting probabilities of IDH wild type based on NaR:NaT are depicted in red (the gray area shows the 95% CI of the predictions). B, IDH mutation status. With a combined optimization of sensitivity and specificity, the logistic regression model yielded an NaR:NaT threshold of 1.35 (Fig 2A and On-line Fig 3; area under the curve = 0.87). IDH mutations were found in 71% of tumors with an NaR:NaT below threshold and in 18% of tumors with an NaR:NaT above threshold. C, Kaplan-Meier estimates of PFS. The estimated percentage of progression-free patients is shown in dependence on time. Patients were divided into 2 groups, having an NaR:NaT value either below or above 1.35. The threshold of 1.35 was derived based on the prediction of IDH mutation status from NaR:NaT (Fig 2A). D, The Cox PH regression model for NaT:NaR. Predicted hazard ratios in dependence on NaR:NaT mean values from the whole tumor VOI are shown. Long gray marks indicate single patient values. A positive hazard ratio indicates an increase in hazard rate that can be attributed to an increase in NaT:NaR. Practically, it describes the relative risk at the instantaneous moment, which is assumed to be constant across time.
Fig 3.
Fig 3.
NaR:NaT values of different tumor classes. The boxplots visualize the mean NaR:NaT of the whole tumor VOI (A) and the CE tumor VOI (B) for different tumor classes. Because of the low sample size, gliomatosis cerebri (n = 1), anaplastic ependymoma (n = 1), and anaplastic oligodendroglioma (n = 1) are not depicted. For NaR:NaT of the whole tumor VOI, GB could be separated from all other gliomas (REST) but not from metastasis. NaR:NaT of the CE tumor VOI enabled all (CE) gliomas to be separated from each other except for PA versus AA (REST). Moreover, GB can be differentiated from metastasis. The box extends from the lower to upper quartile values of the data; lines represent the median; and colored filled circles depict the modal. Vertical axes indicate the range of the data; flier points are shown as black filled circles. O indicates oligodendroglioma; AO, anaplastic oligodendroglioma; AE, anaplastic ependymoma; GC, gliomatosis cerebri; A, astrocytoma; M, metastasis.
Fig 4.
Fig 4.
Ganglioglioma. The neoplasia of a 49-year-old patient (ID no. 2, On-line Table 1) affects the left thalamus, pallidum, and putamen, and is characterized by a largely homogeneous elevated T2-FLAIR signal (A) and somewhat rim-like contrast enhancement (B). Based on 1H-MR imaging, differential diagnostic considerations included low-grade tumors such as GG and PA but also malignant neoplasias such as GB and cerebral metastasis. Na-MR imaging reveals a mean NaR:NaT of 1.39 (whole tumor VOI) and 1.26 (CE tumor VOI) (C and D) compatible with a low-grade tumor (Fig 3A, -B; On-line Fig 2E, -F; On-line Table 1). Thus, the differential diagnoses of GB and M could be ruled out. This result was confirmed by histopathology (On-line Fig 8). Na images are overlaid on T1-weighted postcontrast images; color mesh grid: whole tumor VOI, solid color: CE tumor VOI.
Fig 5.
Fig 5.
Glioblastoma. The left-temporal tumor of a 71-year-old male patient (ID no. 21, On-line Table 1) shows inhomogeneous central and large homogeneous perifocal T2-FLAIR hyperintensities (A). There is a rim-like contrast enhancement of the central tumor portion, as seen on T2-FLAIR (A) and T1-weighted images (B). Na-MR imaging demonstrates a mean NaR:NaT of 1.65 (whole tumor VOI) and 2.02 (CE tumor VOI) (C and D) compatible with GB (Fig 3A, -B; On-line Fig 2G, -H; On-line Table 1). The diagnosis was histopathologically proved (On-line Fig 8). Na-MR images are overlaid onto T1-weighted postcontrast images; color mesh grid: whole tumor VOI, solid color: CE tumor VOI.

References

    1. Louis DN, Ohgaki H, Wiestler OD, et al. . The 2007 WHO classification of tumours of the central nervous system. Acta Neuropathol 2007;114:97–109 10.1007/s00401-007-0243-4 - DOI - PMC - PubMed
    1. Cha S. Neuroimaging in neuro-oncology. Neurotherapeutics 2009;6:465–77 10.1016/j.nurt.2009.05.002 - DOI - PMC - PubMed
    1. White ML, Zhang Y, Kirby P, et al. . Can tumor contrast enhancement be used as a criterion for differentiating tumor grades of oligodendrogliomas? AJNR Am J Neuroradiol 2005;26:784–90 - PMC - PubMed
    1. Scott JN, Brasher PM, Sevick RJ, et al. . How often are nonenhancing supratentorial gliomas malignant? A population study. Neurology 2002;59:947–49 10.1212/WNL.59.6.947 - DOI - PubMed
    1. Price SJ, Gillard JH. Imaging biomarkers of brain tumour margin and tumour invasion. Br J Radiol 2011;84 Spec No 2:S159–67 10.1259/bjr/26838774 - DOI - PMC - PubMed

Publication types