. 2015 Nov 1;29(21):2258-71.
doi: 10.1101/gad.271908.115. Epub 2015 Oct 22.

Silencio/CG9754 connects the Piwi-piRNA complex to the cellular heterochromatin machinery

Affiliations

Silencio/CG9754 connects the Piwi-piRNA complex to the cellular heterochromatin machinery

Grzegorz Sienski et al. Genes Dev. .

Abstract

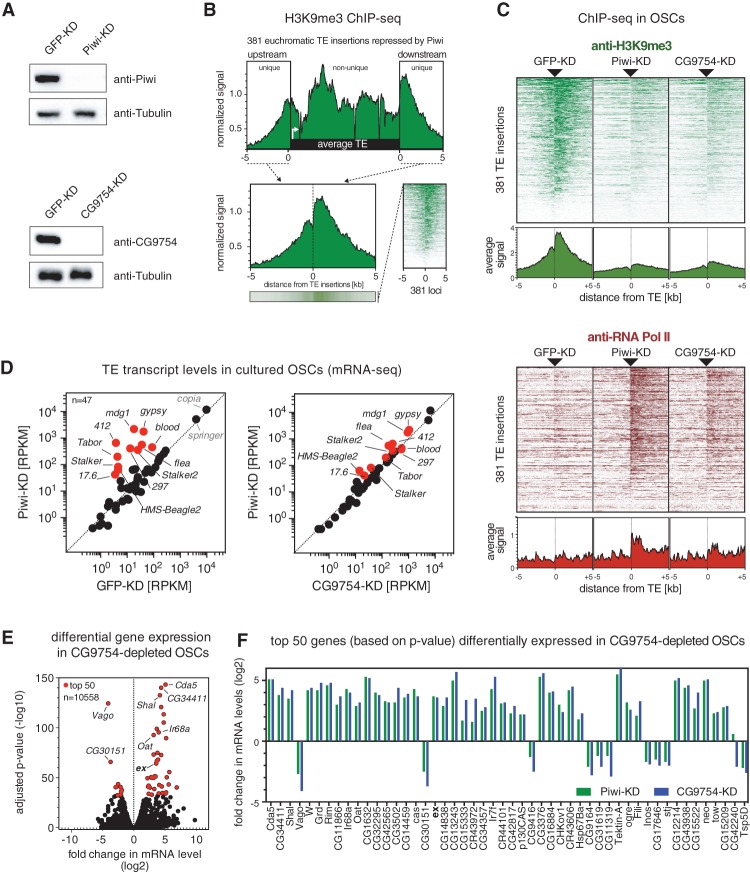
The repression of transposable elements in eukaryotes often involves their transcriptional silencing via targeted chromatin modifications. In animal gonads, nuclear Argonaute proteins of the PIWI clade complexed with small guide RNAs (piRNAs) serve as sequence specificity determinants in this process. How binding of nuclear PIWI-piRNA complexes to nascent transcripts orchestrates heterochromatin formation and transcriptional silencing is unknown. Here, we characterize CG9754/Silencio as an essential piRNA pathway factor that is required for Piwi-mediated transcriptional silencing in Drosophila. Ectopic targeting of Silencio to RNA or DNA is sufficient to elicit silencing independently of Piwi and known piRNA pathway factors. Instead, Silencio requires the H3K9 methyltransferase Eggless/SetDB1 for its silencing ability. In agreement with this, SetDB1, but not Su(var)3-9, is required for Piwi-mediated transcriptional silencing genome-wide. Due to its interaction with the target-engaged Piwi-piRNA complex, we suggest that Silencio acts as linker between the sequence specificity factor Piwi and the cellular heterochromatin machinery.

Keywords: H3K9 methylation; Piwi; heterochromatin formation; piRNA pathway; transcriptional silencing; transposon silencing.


Figures

Figure 1.
Figure 1.
CG9754 elicits transcriptional silencing upon recruitment to nascent RNA or DNA. (A) The cartoon depicts the GFP-5xboxB reporter used for RNA tethering. It harbors the ubiquitous α-tubulin promoter, the GFP-coding sequence, and a 3′ UTR harboring five boxB sites. The confocal image below depicts GFP fluorescence signal in an egg chamber expressing the GFP-boxB reporter. Throughout this study, we converted GFP signal to monochrome images with an inverted black/white color scheme for displaying optimal contrast. Soma and germline tissue is indicated. Images at the right depict the expression of λN-HA fusion proteins under control of the germline-specific MTD-Gal4 driver (λN-GW182: cytoplasmic; λN-Piwi: nuclear-enriched). (B) GFP fluorescence in egg chambers expressing the ubiquitous GFP-boxB reporter and the indicated λN fusions in the germline. (C) Simplified cartoon of the linear piRNA pathway feeding into Piwi, also indicating key players involved at the indicated steps. (TGS) Transcriptional gene silencing. (D) GFP fluorescence in egg chambers expressing the ubiquitous GFP-boxB reporter and the indicated λN fusions in the germline. Expression of LacI-CG9754 served as a negative control. (E) Shown are changes in GFP-boxB steady-state RNA levels in ovaries expressing the indicated λN fusions (normalized to rp49). n = 3. Error bars indicate SD. (F) Shown is RNA Pol II occupancy at the indicated loci determined by chromatin immunoprecipitation (ChIP) followed by quantitative PCR using ovaries expressing the indicated λN fusions. n = 3. Error bars indicate SD. Signals were normalized to those at the TSS of the act 5C gene. arrestin is not expressed in ovaries. (G) The cartoon depicts the 8xlacO-GFP reporter used for DNA tethering. This reporter is expressed in germline and somatic cells of the ovary (nanos promoter coupled to intronic piwi enhancer) (Hayashi et al. 2014). The confocal image below depicts GFP fluorescence signal of the reporter. The middle image depicts the expression of LacI-CG9754 under control of the germline-specific MTD-Gal4 driver. Images at the right show GFP fluorescence signal of the reporter in egg chambers expressing the indicated LacI fusions in the germline. Note that LacI-Piwi accumulates mostly in the cytoplasm (potentially due to the reported oligomerization of LacI) (Supplemental Fig. S1E) and thus cannot be interpreted unambiguously. (H) Shown are GFP fluorescence signals in egg chambers expressing the GFP-boxB reporter, λN-CG9754, and the indicated shRNA constructs in the germline.
Figure 2.
Figure 2.
Genetic characterization of CG9754. (A) Cartoon of the CG9754 protein showing the large unstructured N-terminal region, predicted secondary structure elements at the C terminus, and a predicted nuclear localization signal (NLS). Frameshift positions caused by the guide RNA-induced insertions/deletions and the molecular nature of two alleles (CG9754g1 and CG9754g2) are indicated below. (B) Western blot analysis showing protein levels of CG9754 (top) and Piwi (bottom) in white1118, CG9754g1/g1, CG9754g2/g2, and transheterozygous CG9754g1/g2 ovaries. Tubulin served as a loading control. The asterisk marks an unspecific band. Note that CG9754 migrates at 100 kDa instead of its predicted molecular weight of 61 kDa. (C) Shown are ovarian morphologies from flies of the indicated genotypes. Bar, 500 µm. (D) Depicted are egg-laying rates of females of the indicated genotype (right) and hatching rates of the corresponding laid eggs (left). (E) Bar plot showing fold changes in steady-state RNA levels of somatic (mdg1 and springer) and germline (HeT-A, burdock, and bel) TEs in total ovarian RNA from the indicated genotypes (normalized to rp49). n = 2. Error bars indicate SD. (F) Confocal sections of egg chambers from flies of the indicated genotypes stained simultaneously for CG9754 and Piwi.
Figure 3.
Figure 3.
CG9754 is a core piRNA pathway factor. (A) Western blots showing protein levels of Piwi and CG9754 in the respective siRNA transfected OSCs. (KD) Knockdown. (B) Shown is the metaprofile of H3K9me3 levels calculated from 381 euchromatic insertions of Piwi-repressed TEs in OSCs. Also shown are average signals within the upstream and downstream 5 kb flanking these insertions. For all analyses, we display exclusively the flanking regions, which serve as genome-unique identifications of these TE insertions. In the heat map at the right, signals at all 381 TE insertions were sorted for decreasing intensity. (C) Heat maps showing H3K9me3 levels (green) or RNA Pol II occupancy (red) within the 10 kb flanking the TE insertions (as described in B) in OSCs depleted for GFP (control), Piwi, or CG9754. All heat maps were sorted for decreasing H3K9me3 signal in GFP knockdown cells. The respective average signals are shown below each heat map (GFP knockdown and Piwi knockdown data from Sienski et al. 2012). (D) Scatter plot showing expression levels (reads per kilobase per million sequenced reads) of TEs in OSCs depleted for the indicated factors. TEs in red are those whose abundance changes more than fourfold in Piwi-depleted cells. (E) Scatter plot showing fold change (log2) in mRNA levels and corresponding P-values (adjusted for multiple testing with the Benjamini-Hochberg procedure; −log10) in OSCs depleted for CG9754. The top 50 differentially expressed genes are in red. (F) Shown are the fold changes in mRNA levels of the top 50 (according to P-value as in E) deregulated genes in CG9754-depleted OSCs in Piwi-depleted cells.
Figure 4.
Figure 4.
CG9754/Silencio interacts with target-engaged Piwi–piRNA complexes. (A) Western blots showing reciprocal co-IP of endogenous CG9754 with endogenous Piwi from nuclear OSC lysate (relative amount loaded in immunoprecipitation lanes; 10×; mouse IgGs were used as negative control). (B) Scatter plot showing levels of 3′ UTR-derived piRNAs in Piwi (green) and CG9754 (blue) immunoprecipitates in comparison with levels in a total small RNA library (shown are the top 100 genic piRNA sources in OSCs; values were normalized to 1 million sequenced reads per library). Each point shows the average value of two biological replicates, and error bars represent SEM. (C) Bar graphs showing size distribution and first nucleotide composition of small RNAs mapping in sense (top) or antisense (bottom) orientation to TEs regulated by Piwi in OSCs (note the different scales for sense and antisense). Reads from total small RNA (left), Piwi immunoprecipitation (middle), and CG9754 immunoprecipitation (right) are compared. (D) Cartoon of a Piwi–piRNA complex bound to a target RNA. (Below) Sequence logos indicating the 5′ and 3′ nucleotide bias of TE antisense reads (piRNAs) and sense reads (target RNAs) are shown. (E) Bar graphs displaying the fold enrichment of sense reads in the indicated immunoprecipitation libraries over the total small RNA library on all annotated TEs. n = 102. Two independent experiments are shown; error bars represent SEM. The black bars show corresponding piRNA levels in OSCs. The heat map below displays the fold changes in TE RNA levels upon Piwi depletion in OSCs. (F) Shown are density plots of normalized small RNA reads from CG9754 immunoprecipitation (sense), Piwi immunoprecipitation (sense), and total small RNAs (antisense) mapping to the mdg1 element. The piRNA-free gap in mdg1 is depicted.
Figure 5.
Figure 5.
Silencing and heterochromatin formation by CG9754/Silencio depends on the H3K9 methyltransferase SetDB1. (A) Shown are GFP fluorescence signals in egg chambers expressing the GFP-boxB reporter and the indicated λN fusions. The bar diagram shows corresponding H3K9me3 levels at the indicated loci, measured by ChIP followed by qPCR (values were normalized to a gene desert; light is a heterochromatic control locus). Displayed is the mean of three independent experiments. Error bars indicate SD. The cartoons detail the reporter locus and the endogenous α-tubulin locus in scale and depict the location of used primer pairs. (B) Everything is as in A except for the lacO-GFP reporter experiment. (C) Shown are GFP fluorescence signals in egg chambers expressing the GFP-boxB reporter, λN-CG9754, and the indicated shRNA constructs in the germline [two independent shRNA lines for Su(var)3-9 were used with similar results]. (D) As in C except for the lacO-GFP reporter.
Figure 6.
Figure 6.
Distinct roles for Eggless/SetDB1 and Su(var)3-9 at piRNA-repressed TE insertions. (A) Heat maps showing H3K9me3 signal (green) and RNA Pol II occupancy (red) on the 10 kb flanking the 381 euchromatic TE insertions targeted by Piwi in OSCs. Signals from GFP-depleted cells (control) were compared with cells depleted for CG9754, SetDB1, Su(var)3-9, G9a, or HP1a. All heat maps were sorted for the average H3K9me3 intensity in the control experiment. Below each heat map, area charts represent the average signal. (B) Box plot showing changes in H3K9me3 levels at euchromatic H3K9me3 peaks (enriched in Piwi-repressed TE insertions) and heterochromatic H3K9me3 peaks in OSCs depleted for the indicated factors. The identities of analyzed H3K9me3 peaks are as in Sienski et al. (2012). (C) Bar graph showing mean levels of piRNAs derived from flamenco and cluster 20A (each bar is the average value of piRNA densities in 40 nonoverlapping 1-kb windows) in OSCs depleted for the indicated factors (values were normalized for those present in GFP knockdown control cells). Error bars correspond to SEM. (D) Jitter plot showing fold changes in mRNA levels of TEs in the indicated knockdowns. The top panel displays TEs regulated by Piwi. Fold change, >4; n = 11. (****) P-value < 0.0001, according to Mann-Whitney test. The bottom panel displays TEs not regulated by Piwi. n = 36. (E) Metaprofile showing HP1a occupancy at the genomic regions flanking the 381 euchromatic TE insertions that are repressed by Piwi in wild-type as well as Piwi-depleted OSCs (using two different HP1a antibodies). (F) Bar diagram showing the occupancy of HP1a and Su(var)3-9 at the indicated loci in wild-type OSCs (light and parp are loci within constitutive heterochromatin). n = 2. Error bars indicate SD. (G) Shown is the average H3K9me3 signal at genomic regions flanking the 146 euchromatic gypsy insertions in OSCs depleted for the indicated factors.

Similar articles

Cited by

References

    1. Audergon PN, Catania S, Kagansky A, Tong P, Shukla M, Pidoux AL, Allshire RC. 2015. Epigenetics. Restricted epigenetic inheritance of H3K9 methylation. Science 348: 132–135. - PMC - PubMed
    1. Aygun O, Mehta S, Grewal SI. 2013. HDAC-mediated suppression of histone turnover promotes epigenetic stability of heterochromatin. Nat Struct Mol Biol 20: 547–554. - PMC - PubMed
    1. Ayyanathan K, Lechner MS, Bell P, Maul GG, Schultz DC, Yamada Y, Tanaka K, Torigoe K, Rauscher FJ III. 2003. Regulated recruitment of HP1 to a euchromatic gene induces mitotically heritable, epigenetic gene silencing: a mammalian cell culture model of gene variegation. Genes Dev 17: 1855–1869. - PMC - PubMed
    1. Baron-Benhamou J, Gehring NH, Kulozik AE, Hentze MW. 2004. Using the λN peptide to tether proteins to RNAs. Methods Mol Biol 257: 135–154. - PubMed
    1. Bayne EH, White SA, Kagansky A, Bijos DA, Sanchez-Pulido L, Hoe KL, Kim DU, Park HO, Ponting CP, Rappsilber J, et al. 2010. Stc1: a critical link between RNAi and chromatin modification required for heterochromatin integrity. Cell 140: 666–677. - PMC - PubMed

Publication types

MeSH terms

Associated data