. 2015 Oct 15;29(20):2081-96.
doi: 10.1101/gad.267989.115.

FoxP1 orchestration of ASD-relevant signaling pathways in the striatum

Affiliations

FoxP1 orchestration of ASD-relevant signaling pathways in the striatum

Daniel J Araujo et al. Genes Dev. .

Abstract

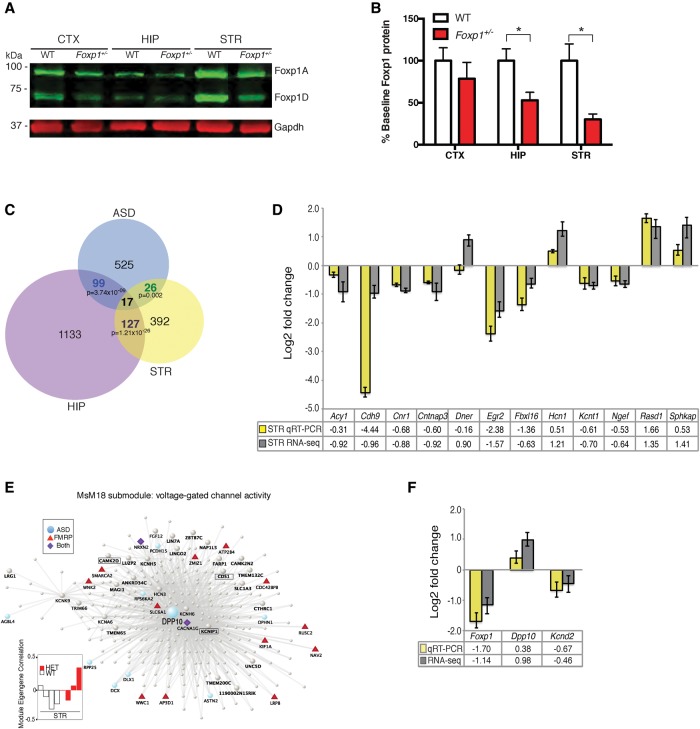
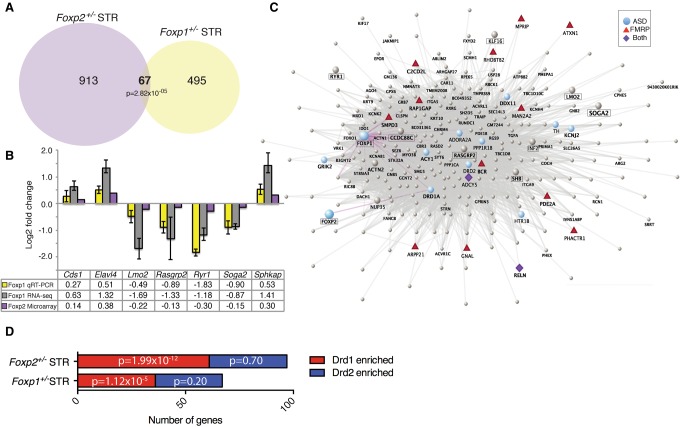
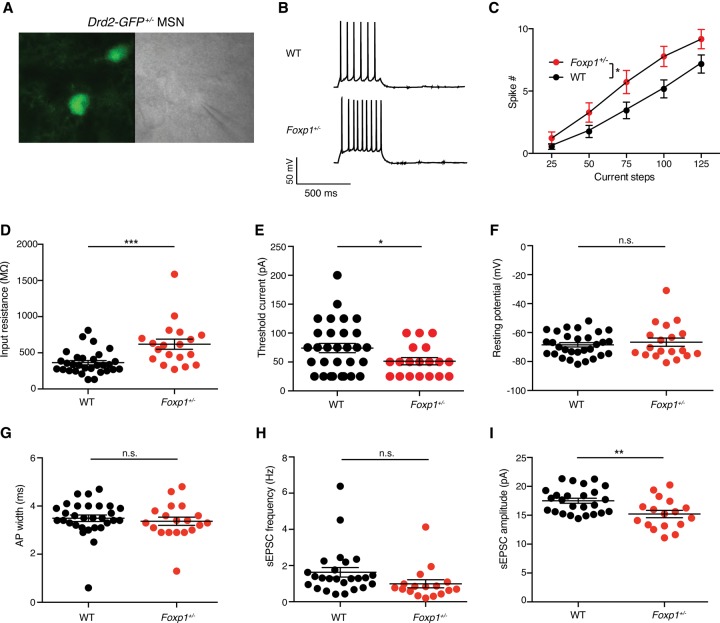
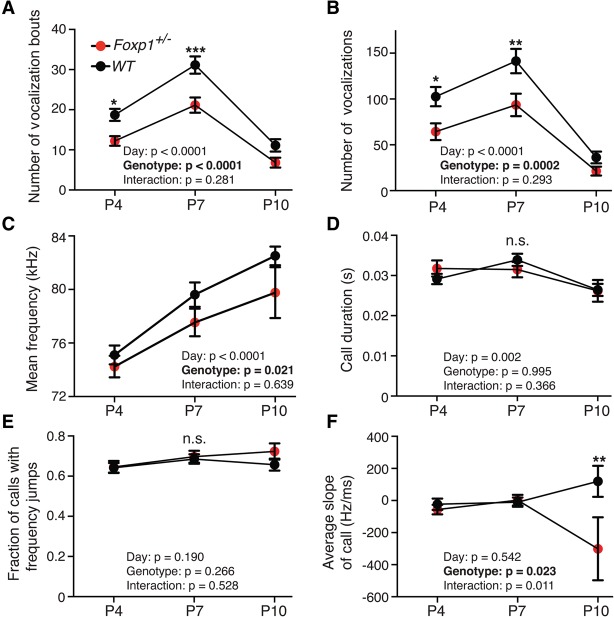
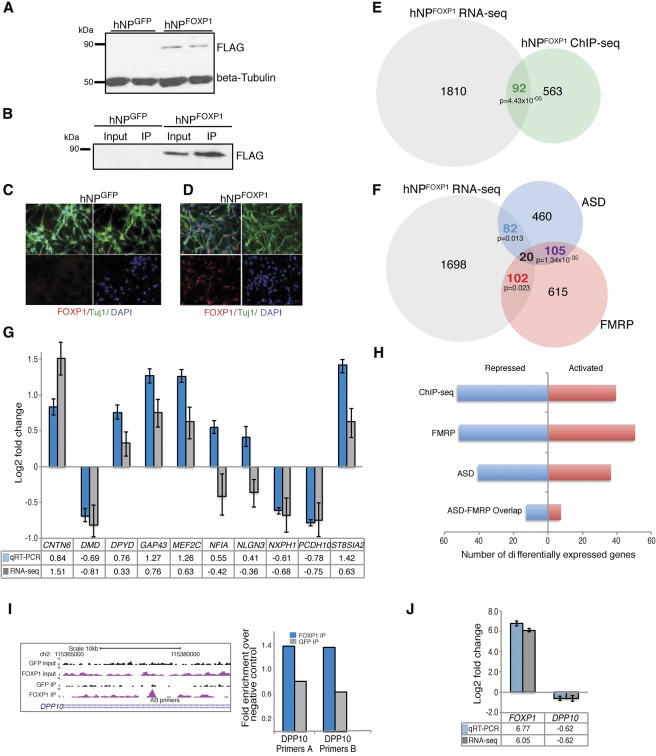
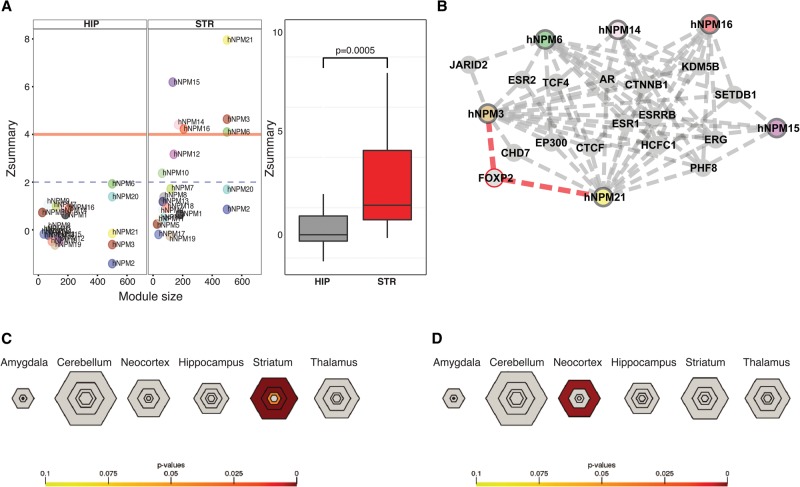
Mutations in the transcription factor Forkhead box p1 (FOXP1) are causative for neurodevelopmental disorders such as autism. However, the function of FOXP1 within the brain remains largely uncharacterized. Here, we identify the gene expression program regulated by FoxP1 in both human neural cells and patient-relevant heterozygous Foxp1 mouse brains. We demonstrate a role for FoxP1 in the transcriptional regulation of autism-related pathways as well as genes involved in neuronal activity. We show that Foxp1 regulates the excitability of striatal medium spiny neurons and that reduction of Foxp1 correlates with defects in ultrasonic vocalizations. Finally, we demonstrate that FoxP1 has an evolutionarily conserved role in regulating pathways involved in striatal neuron identity through gene expression studies in human neural progenitors with altered FOXP1 levels. These data support an integral role for FoxP1 in regulating signaling pathways vulnerable in autism and the specific regulation of striatal pathways important for vocal communication.

Keywords: autism; gene expression; neuronal activity; striatum; ultrasonic vocalizations.


Figures

Figure 1.
Figure 1.
Regulation of ASD genes by Foxp1 in the mouse brain. (A) Representative immunoblot displaying reduced Foxp1 protein levels in the hippocampus (HIP) and striatum (STR), but not the neocortex (CTX), of Foxp1+/− mice. Gapdh was used as a loading control. (B) Quantification of Foxp1 expression in adult Foxp1+/− mouse brains. Data are represented as means ± SEM. n= 4 mice per genotype for each region. (*) P = 0.033 (hippocampus); (*) P = 0.0163 (striatum), Student's t-test, compared with wild-type levels normalized to Gapdh. (C) Venn diagram showing overlaps between the differentially expressed genes (DEGs) in the mouse and ASD gene lists (144 genes between the hippocampus and striatum [P = 1.21 × 10⁻²⁶], 116 genes between the hippocampus and ASD [P = 3.74 × 10⁻⁹], and 43 genes between the striatum and ASD [P = 0.002], hypergeometric test [P-values were adjusted using Benjamini-Hochberg FDR procedure]). (D) Confirmation of salient ASD-related gene targets in independent striatal samples from Foxp1+/− mice using quantitative RT–PCR (qRT–PCR). Data are represented as means ± SEM. n = 4 mice per genotype. With the exception of Dner, all qRT–PCR values displayed are significant at P < 0.05 (Student's t-test, compared with wild-type levels normalized to actin). (E) Visualization of a striatal-specific submodule (MsM18) that contains Dpp10 (dipeptidyl peptidase) as a major hub gene. (F) qRT–PCR confirmation of Dpp10 and Kcnd2 activation in Foxp1+/− mouse striatal samples. Data are represented as means ± SEM. n = 4 mice per genotype. All qRT–PCR values displayed are significant at P < 0.05 (Student's t-test, compared with wild-type levels normalized to actin).
Figure 2.
Figure 2.
Foxp1 and Foxp2 regulate overlapping targets within the striatum. (A) Significant overlap of DEGs in the striatum of Foxp1+/− and Foxp2+/− mice (67 genes between the Foxp1+/− and the Foxp2+/− striatal data sets [P = 2.82 × 10⁻⁵], hypergeometric test). (B) qRT–PCR confirmation of a subset of these genes in independent Foxp1+/− striatal samples. Data are represented as means ± SEM. n = 3 mice per genotype. All qRT–PCR values displayed are significant at P < 0.05 (Student's t-test, compared with wild-type levels normalized to actin). (C) Visualization of the regionally specific striatal module MsM3 showing coexpression of both Foxp1 and Foxp2. Foxp1 and Foxp2 connections are highlighted in magenta. Genes in bold typeface indicate striatal DEGs, and boxed genes indicate Foxp1 and Foxp2 DEGs that overlap. (D) RNA-seq data from Foxp1+/− mice and microarray data from Foxp2+/− mice were overlapped with the most recently published list of known enriched transcripts within D1+ or D2+ MSNs (Maze et al. 2014). Genes from both Foxp1+/− and Foxp2+/− mice significantly overlapped with D1+ MSN-enriched genes (36 genes [P = 1.12 × 10⁻⁵] and 61 genes [P = 1.99 × 10⁻¹²], respectively, hypergeometric test). P-values for each overlap are shown within bar graphs.
Figure 3.
Figure 3.
D2+ MSNs of Foxp1+/− mice have increased excitability. (A) Example image of a recorded GFP+ (D2+) neuron. (B) Example recordings depicting spiking in response to a 125-pA current step in control and Foxp1+/− MSNs. (C) Firing rate versus input curves is significantly increased in Foxp1+/− MSNs. Data are represented as means ± SEM. n = 18 wild-type cells and 29 Foxp1+/− cells. (*) P = 0.040, two-way ANOVA with repeated measures for current step, compared between genotypes. (D) Input resistance is significantly increased Foxp1+/− MSNs. Data are represented as means ± SEM. n = 19 wild-type cells and 30 Foxp1+/− cells. (***) P = 0.0004, Student's t-test, compared between genotypes. (E) The minimum, threshold current required for evoking an action potential is significantly decreased in Foxp1+/− MSNs. Data are represented as means ± SEM. n = 19 wild-type cells and 30 Foxp1+/− cells. (*) P = 0.049, Student's t-test, compared between genotypes. (F) Resting potential is not significantly changed in Foxp1+/− MSNs. Data are represented as means ± SEM. n = 19 wild-type cells and 30 Foxp1+/− cells. P = 0.53, Student's t-test, compared between genotypes. (G) Action potential width is not significantly altered in Foxp1+/− MSNs. Data are represented as means ± SEM. n = 19 wild-type cells and 30 Foxp1+/− cells. P = 0.57, Student's t-test, compared between genotypes. (H) Spontaneous EPSC frequency is not significantly changed in Foxp1+/− MSNs. Data are represented as means ± SEM. n = 17 wild-type cells and 25 Foxp1+/− cells. P = 0.091, Student's t-test, compared between genotypes. (I) Spontaneous EPSC amplitude is significantly decreased in Foxp1+/− MSNs. Data are represented as means ± SEM. n = 17 wild-type cells and 25 Foxp1+/− cells. (**) P = 0.004, Student's t-test, compared between genotypes.
Figure 4.
Figure 4.
Foxp1 haploinsufficiency results in reduced mouse vocalizations. (A) Foxp1+/− mouse pups exhibit a significantly reduced number of vocalization bouts. Data are represented as means ± SEM. n = 57 wild-type pups and 34 Foxp1+/− pups. (*) P = 0.033 at P4; (***) P = 0.0003 at P7, two-way ANOVA with a Sidak multiple comparison test, compared between genotypes. (B) Foxp1+/− mouse pups exhibit fewer total numbers of USVs at P7. Data are represented as means ± SEM. n = 57 wild-type pups and 34 Foxp1+/− pups. (*) P = 0.038 at P4; (**) P = 0.006 at P7, two-way ANOVA with a Sidak multiple comparison test, compared between genotypes. (C) As a trend, Foxp1+/− mouse pups exhibit a significant reduction in their mean call frequency across all days. Data are represented as means ± SEM. n = 57 wild-type pups and 34 Foxp1+/− pups. Two-way ANOVA with a Sidak multiple comparison test, compared between genotypes. (D) Foxp1+/− mice show no differences in average call duration. Data are represented as means ± SEM. n = 57 wild-type pups and 34 Foxp1+/− pups. P = 0.99, two-way ANOVA with a Sidak multiple comparison test, compared between genotypes. (E) Foxp1+/− mice show no difference in the fraction of calls with frequency jumps. Data are represented as means ± SEM. n = 57 wild-type pups and 34 Foxp1+/− pups. P = 0.27, two-way ANOVA with a Sidak multiple comparison test, compared between genotypes. (F) Foxp1+/− mice display a significant reduction in the average slope of a call at P10. Data are represented as means ± SEM. n = 57 wild-type pups and 34 Foxp1+/− pups. (**) P = 0.001, two-way ANOVA with a Sidak multiple comparison test, compared between genotypes. The main effects for genotype and postnatal day and the interactions between these two variables are reported at the bottom of each panel.
Figure 5.
Figure 5.
Gene regulation by FOXP1 in human neural cells. (A) Representative immunoblot depicting overexpression of FOXP-Flag signal in hNPs transduced with a FOXP1-Flag expression construct (hNPFOXP1) but not in hNPs with a GFP expression construct (hNPGFP). β-Tubulin was used as a loading control. (B) Representative immunoblot confirming expression of FOXP1-Flag in input samples and enrichment of FOXP1-Flag during the immunoprecipitation (IP) portion of ChIP from hNPFOXP1 lysates. (C,D) Representative images of hNPGFP and hNPFOXP1 demonstrate that FOXP1 expression (red) in hNPFOXP1 is restricted to the nucleus (DAPI, blue) and that FOXP1 is not expressed within neurites (Tuj1, green) and is absent in hNPGFP. (E) Significant overlap between gene targets from RNA-seq and ChIP-seq (ChIP followed by DNA sequencing) performed on hNPFOXP1 (92 genes between hNPFOXP1 RNA-seq and hNPFOXP1 ChIP-seq [P = 4.43 × 10⁻⁵, hypergeometric test]). (F) Significant overlap among RNA-seq DEGs, ASD genes, and FMRP targets (102 genes between hNPFOXP1 RNA-seq and ASD genes [P = 0.013], 122 genes between hNPFOXP1 RNA-seq and FMRP genes [P = 0.023], and 125 genes between ASD and FMRP genes [P = 1.34 × 10⁻³⁵], hypergeometric test [P-values were adjusted using Benjamini-Hochberg FDR procedure]). (G) qRT–PCR confirmation of a subset of these overlapping genes in independent hNPFOXP1 samples. Data are represented as means ± SEM. n = 4 samples per treatment. All qRT–PCR values displayed are significant at P < 0.05 (Student's t-test, compared with hNPGFP levels normalized to actin). (H) DEGs from these overlaps are equally represented among repressed and activated genes. (I, left panel) Human genome browser view showing the ChIP-seq result of enrichment of FOXP1 binding compared with GFP control. (Right panel) ChIP-PCR confirmation of enriched binding of DPP10 by FOXP1 in hNPFOXP1 compared with hNPGFP using two separate primer pairs (DPP10 primers A and B) compared with control primers. Quantified data are represented as means ± SEM, four samples per treatment. All qRT–PCR values displayed are significant at P < 0.05 (Student's t-test, compared with hNPGFP levels normalized to actin). (J) DPP10 is repressed with FOXP1 overexpression in hNPFOXP1 samples. Quantified data are represented as means ± SEM, four samples per treatment. All qRT–PCR values displayed are significant at P < 0.05 (Student's t-test, compared with hNPGFP levels normalized to actin).
Figure 6.
Figure 6.
Coexpression network preservation between mouse and human data sets. (A) Module preservation analysis revealed that significantly more hNP modules are preserved in the striatum compared with the hippocampus. Zsummary scores >4 are well preserved, and those <2 are poorly preserved. (B) Genes in modules shared between humans and mice contain conserved binding sites for ASD-associated transcription factors, including FoxP2. (C) Genes down-regulated by loss of Foxp1 in mice and up-regulated by overexpression of FOXP1 in hNPs are enriched for striatal-associated genes. (D) Genes up-regulated by loss of Foxp1 in mice and down-regulated by overexpression of FOXP1 in hNPs are enriched for cortical genes. Briefly, hexagons are scaled to the stringency values of the specificity index thresholds (pSI), which ranks the region-specific enriched transcript gene lists from least specific to highly specific transcripts; i.e., outer hexagons represent larger, less specific lists (pSI of 0.05), while inner hexagons represent shorter, highly specific lists (pSI of 0.001). Bonferroni-Hochberg (BH)-corrected P-values are shown.

Similar articles

Cited by

References

    1. Ade KK, Wan Y, Chen M, Gloss B, Calakos N. 2011. An improved BAC transgenic fluorescent reporter line for sensitive and specific identification of striatonigral medium spiny neurons. Front Syst Neurosci 5: 32. - PMC - PubMed
    1. Agmon A, Connors BW. 1991. Thalamocortical responses of mouse somatosensory (barrel) cortex in vitro. Neuroscience 41: 365–379. - PubMed
    1. Anders S, Pyl PT, Huber W. 2014. HTSeq—a Python framework to work with high-throughput sequencing data. Bioinformatics 31: 166–169. - PMC - PubMed
    1. Bacon C, Rappold GA. 2012. The distinct and overlapping phenotypic spectra of FOXP1 and FOXP2 in cognitive disorders. Hum Genet 131: 1687–1698. - PMC - PubMed
    1. Bacon C, Schneider M, Le Magueresse C, Froehlich H, Sticht C, Gluch C, Monyer H, Rappold GA. 2015. Brain-specific Foxp1 deletion impairs neuronal development and causes autistic-like behaviour. Mol Psychiatry 20: 632–639. - PMC - PubMed

Publication types

MeSH terms

Associated data