. 2015 Oct 15;29(20):2203-16.
doi: 10.1101/gad.267914.115.

Feedback control of growth, differentiation, and morphogenesis of pancreatic endocrine progenitors in an epithelial plexus niche

Affiliations

Feedback control of growth, differentiation, and morphogenesis of pancreatic endocrine progenitors in an epithelial plexus niche

Eric D Bankaitis et al. Genes Dev. .

Abstract

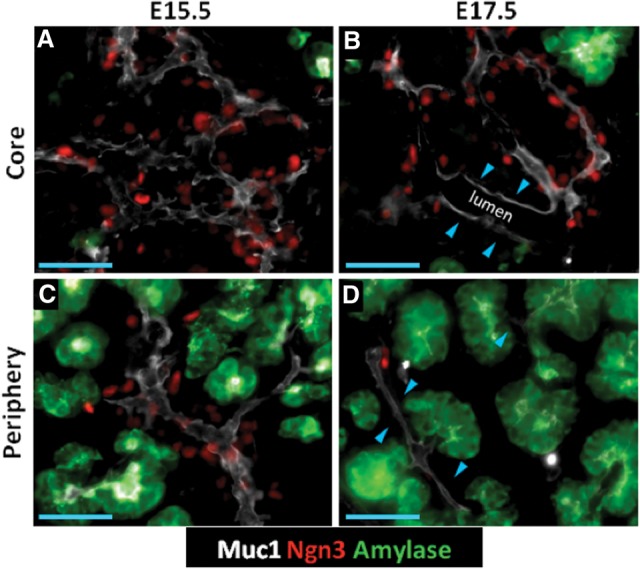
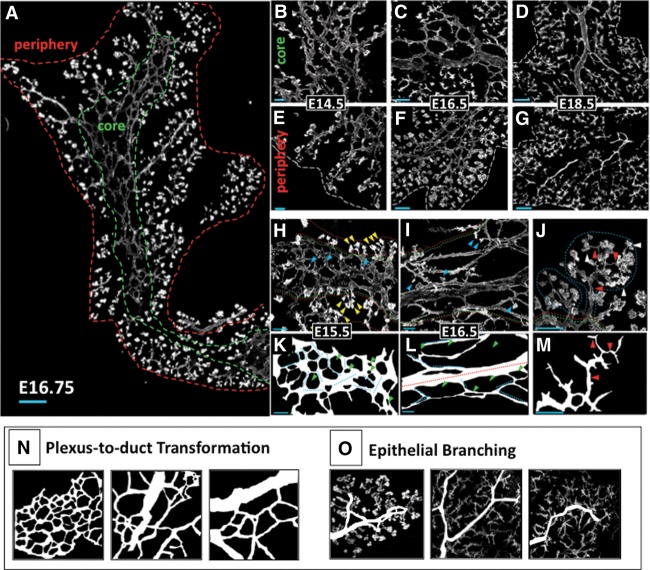
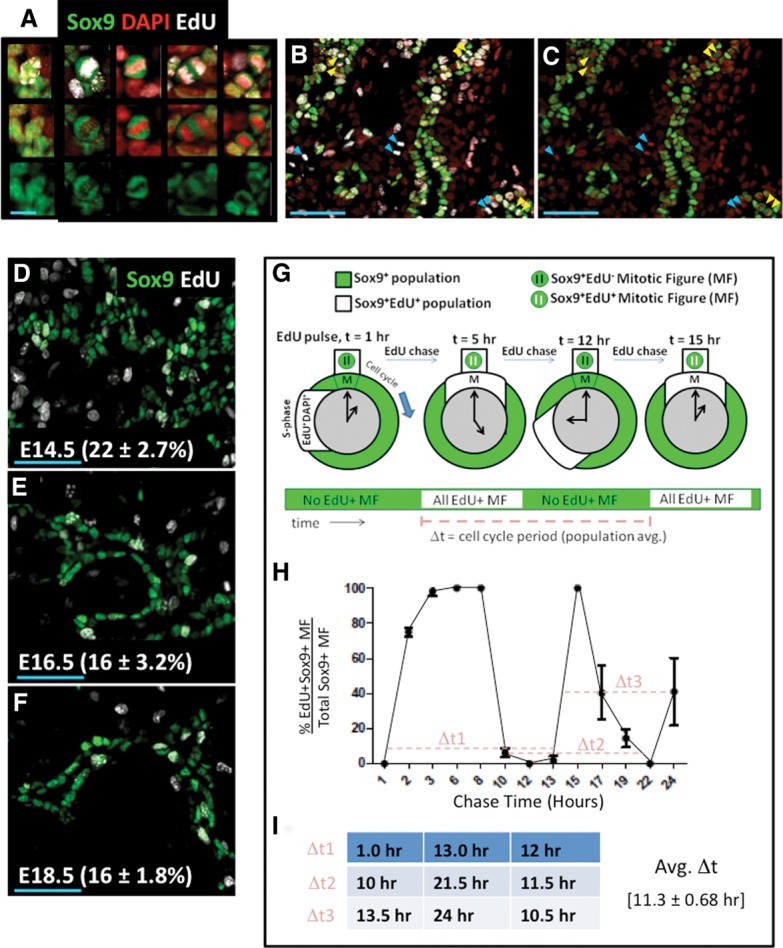
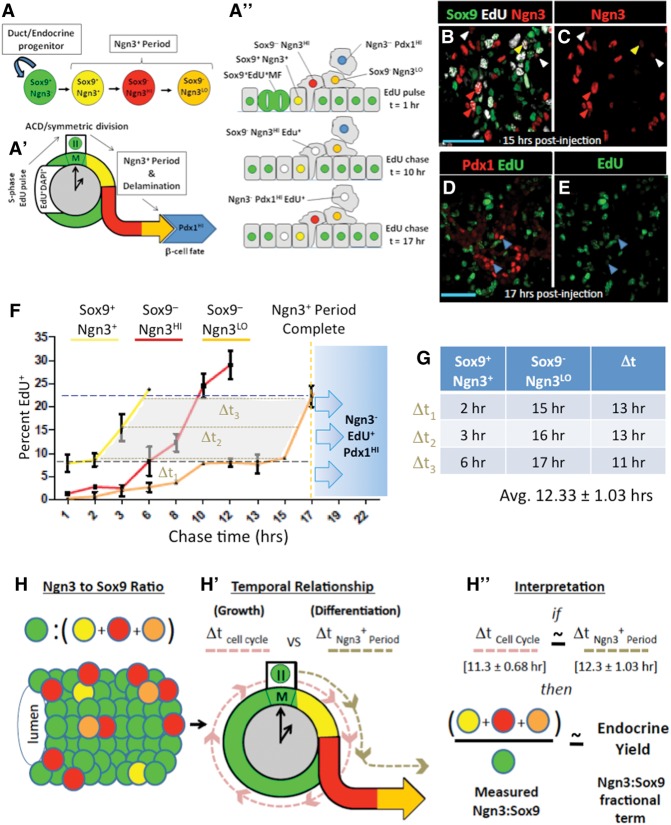
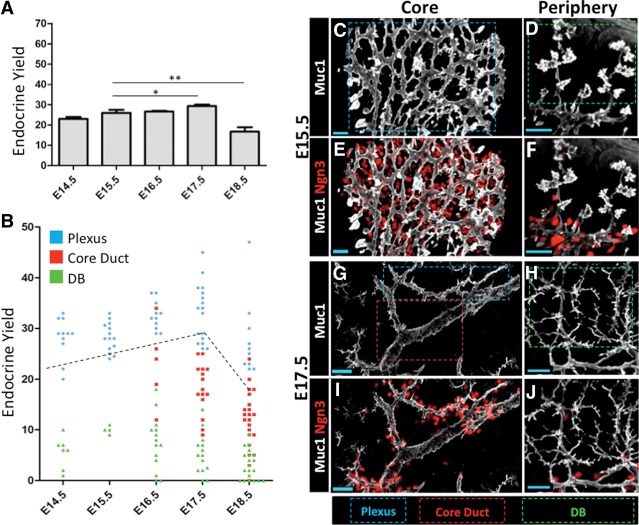
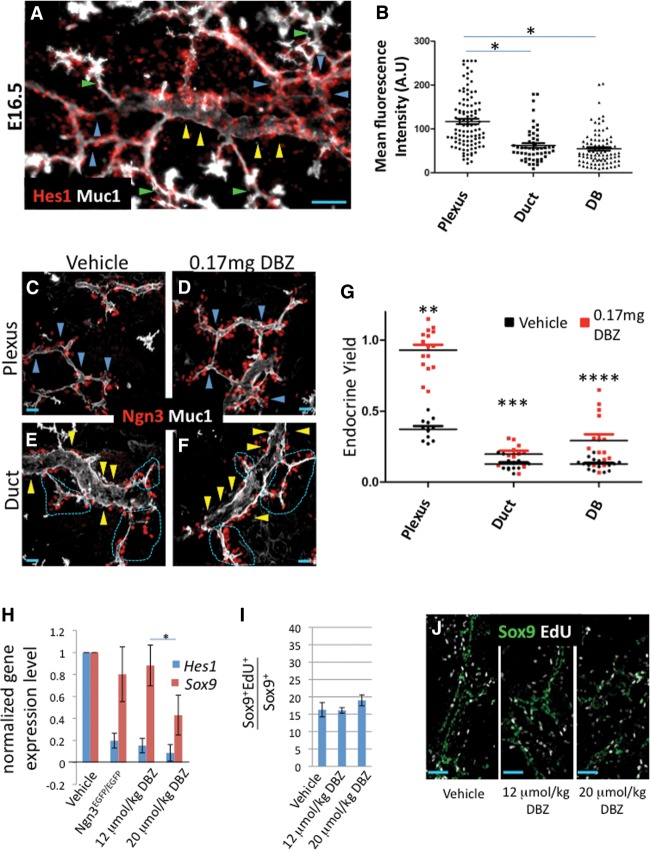
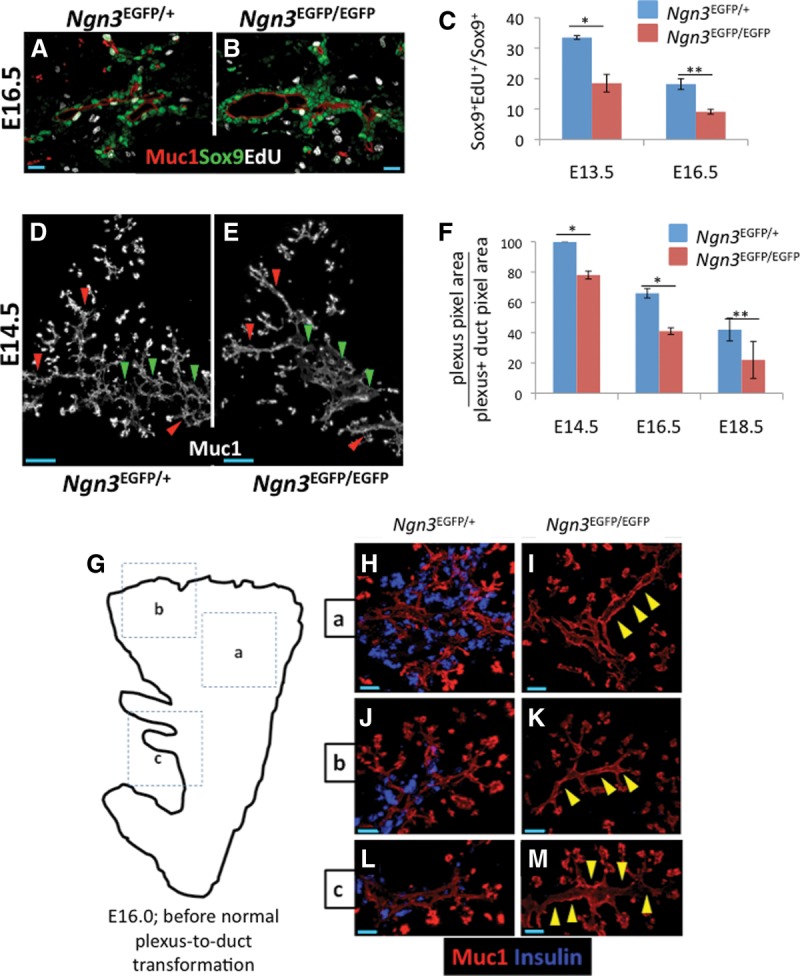
In the mammalian pancreas, endocrine cells undergo lineage allocation upon emergence from a bipotent duct/endocrine progenitor pool, which resides in the "trunk epithelium." Major questions remain regarding how niche environments are organized within this epithelium to coordinate endocrine differentiation with programs of epithelial growth, maturation, and morphogenesis. We used EdU pulse-chase and tissue-reconstruction approaches to analyze how endocrine progenitors and their differentiating progeny are assembled within the trunk as it undergoes remodeling from an irregular plexus of tubules to form the eventual mature, branched ductal arbor. The bulk of endocrine progenitors is maintained in an epithelial "plexus state," which is a transient intermediate during epithelial maturation within which endocrine cell differentiation is continually robust and surprisingly long-lived. Within the plexus, local feedback effects derived from the differentiating and delaminating endocrine cells nonautonomously regulate the flux of endocrine cell birth as well as proliferative growth of the bipotent cell population using Notch-dependent and Notch-independent influences, respectively. These feedback effects in turn maintain the plexus state to ensure prolonged allocation of endocrine cells late into gestation. These findings begin to define a niche-like environment guiding the genesis of the endocrine pancreas and advance current models for how differentiation is coordinated with the growth and morphogenesis of the developing pancreatic epithelium.

Keywords: endocrine; niche; organogenesis; plexus; progenitor.


Figures

Figure 1.
Figure 1.
Ngn3+ populations show nonrandom localization patterns within the trunk. (AD) Epifluorescence images of core and peripheral regions in 10-µm cryosections showing Muc1, Ngn3, and amylase. (A,C) Ngn3+ cells distributed over the Muc1+ lumen surface. (B,D) Regions of lumen where Ngn3+ cells are reduced in number. (Blue arrowheads in B) Enlarged lumen in the core; (blue arrowheads in D) lumen interconnecting amylase+ tips. Bars, 50 μm.
Figure 2.
Figure 2.
Epithelial morphogenesis comprises plexus remodeling in the core and epithelial branching in the periphery. (A) Composite 10× images of a 45-µm-thick cryosectioned dorsal pancreas at E16.75. Green and red dashed lines bound the core and periphery, respectively. (BD) Muc1-labeled 35-µm-thick cryosections showing typical progression through plexus expansion and duct transformation in the core. (EG) Epithelial branching in the periphery. (White dashed line) Outer organ boundary. (HM) Confocal z-stacks show features of plexus (H,K), duct (I,L), and ductal branch (DB) (J,M) states. (I,J) Core (green dashed line) and periphery (red dashed line) are shown. Small, unclefted DBs in the core (blue arrowheads), clefted DBs in the periphery (yellow arrowheads in H), lobes of DBs (blue dashed line), Muc1+ lumen of proacinar tips (white arrowheads in J), and connecting lumen (red arrowheads in J) are shown. (KM) Line traces of lumen from H–J. Individual segments of plexus (dotted light blue lines) and core duct states (red dashed line) are shown. Note the increase in lumen diameter and the continuous directionality across a representative 40× field of the duct state in L relative to the plexus in K. (Green arrowheads) Unlabeled cell fields (epithelial and parenchymal) bounded by Muc1 signal. (N,O) Traced representations of the processes of plexus-to-duct transformation in the core and epithelial branching in the periphery. Bars: B,E,H-J, 20 μm; C,F, 50 μm; A,D,G, 100 μm.
Figure 3.
Figure 3.
EdU pulse-chase analysis measured average cell cycle period in Sox9+ cells. (A) Individual Sox9+EdU+ cells captured before and during mitosis. (Left to right) Sox9+ cells not in mitosis and MFs in prophase, metaphase, anaphase, and cytokinesis. Bar, 10 μm. (B,C) MFs observed in a representative 20× field at E14.5, 3 h after EdU injection. (Yellow arrowheads) Sox9+EdU+ MFs; (cyan arrowheads) Sox9EdU+ MFs; (doublet arrowheads) MFs after DNA segregation into daughters. Bars, 50 μm. (DF) One-hour S-phase indices were similar from E14.5–E18.5. Bar, 50 μm. (G) Diagram of EdU pulse chase in replicating Sox9+ populations. Sox9+ cells undergoing S phase were labeled by EdU. EdU+Sox9+ populations (white) undergo and complete mitosis (t = 5 h) before undergoing a subsequent round of mitosis (t = 12–15 h). Rounds of mitosis can be tracked by monitoring waves of EdU positivity in the Sox9+ MF states (green and white bar over time). Time differences (“Δt”s) are determined from intervals between waves of EdU+ MFs. (H) Twenty-four-hour EdU pulse-chase analysis of cell cycle period in Sox9+ populations, with “Δt”s represented by a dashed light-red line. (I) Calculation of average Δt from pulse-chase measurements in H. Error bars are SEM.
Figure 4.
Figure 4.
EdU pulse chase measures duration of the Ngn3+ period of endocrine commitment. (AA′′) Pulsed EdU was incorporated in Sox9+ cells at S phase and chased (EdU+ DNA in white) through marker-defined stages of Ngn3 positivity. (B,C) EdU captured in cells of various Ngn3+ states. (Yellow arrowheads) Early Sox9+Ngn3+ cells; (red arrowheads) Sox9Ngn3HI cells; (white arrowheads) late Sox9Ngn3LO cells. (D,E) EdU in Ngn3Pdx1HI cells (blue arrowheads). (F) Time course for EdU pulse-chase analysis of the Ngn3+ period. The graph indicates the percentage of EdU+ cells in Sox9+Ngn3+ (yellow line), Sox9Ngn3HI (red line), or Sox9Ngn3LO (orange line) states at the time points indicated. The blue dashed line shows a 1-h EdU incorporation baseline for Sox9+Ngn3 cells (22% ± 2.7%). (Black dashed line) One-hour EdU incorporation baseline for Sox9+Ngn3+ cells (8.5% ± 2.8%). Blue shading with arrows indicates the period when EdU+ DNA becomes increasingly observed in Ngn3Pdx1HI populations (indicating the end of the Ngn3+ period). The gray shaded area indicates the domain and range of data points used to estimate the Ngn3+ period. (G) Calculation of Δt (brown dashed lines in F) from the lines demarcating Sox9+Ngn3+ and Sox9Ngn3LO cell states. Error bars indicate standard deviations. N = 3 pancreata. (HH′′) Derivation of endocrine yield as a quantitative measure of the relative magnitude of endocrine differentiation from the trunk domain.
Figure 5.
Figure 5.
Endocrine differentiation is enriched in the plexus state. (A) Bulk endocrine yields determined from analysis of 10-µm sections. Thirty percent of the dorsal pancreas was scored. Error bars are SEM. (*) P = 0.1161; (**) P = 0.0249, Student's t-test. (B) Comparison of endocrine yield in the plexus, duct, and DB states. Each point represents endocrine yield summed from individual 35- to 50-µm-thick 40× z-stacks. E14.5–E18.5 plexus versus DB, P < 0.0001; E17.5 and E18.5 plexus versus duct, P < 0.0001; E16.5 plexus versus duct, P = 0.0019. Error bars are SEM; Student's t-test. Bulk endocrine yield as determined in A (black dashed line). (CJ) Representative images of Ngn3+ cells in relation to the plexus (blue dashed box), duct (red dashed box), and DB (green dashed box) states. Bars, 20 μm.
Figure 6.
Figure 6.
Notch-responsive progenitors are enriched in the plexus state. (A) Detection of Hes1 relative to the Muc1+ duct state (yellow arrowheads), plexus state (blue arrowheads), and DBs (green arrowheads). Bar, 50 μm. (B) Mean nuclear intensity of Hes1 signal in individual Sox9+ cells. N = 102 plexus; N = 91 DBs, ([*] P < 0.0001); N = 52 duct (P < 0.0001) from three separate z-stack volumes. Error bars are SEM; Student's t-test. (CF) Representative images of Muc1 and Ngn3 in the plexus and duct states under vehicle or DBZ treatment. Blue arrowheads delineate the plexus in C and D, yellow arrowheads indicate the surface of ductal states in E and F, and dashed magenta lines delineate locations where the Ngn3-rich plexus intersects with the duct state. Bar, 20 μm. (G) Endocrine yield in the plexus, duct, and DB states under vehicle or DBZ treatment. Each point represents endocrine yields summed from individual 40× z-stack volumes (∼35–50 µm thick). N = 11 plexus; N = 12 duct; N = 15 DB in vehicle control. N = 16 plexus; N = 11 duct; N = 15 DB in the DBZ-treated group. n = 3 for both conditions. Error bars are SEM. (**) P < 0.0001; (***) P = 0.0149; (****) P = 0.0013, Student's t-test. (H) Normalized gene expression for Sox9 and Hes1 under control, Ngn3-deficient, and DBZ-treated conditions. Error bars are SEM. n ≥ 3 for each condition. (*) P = 0.0373. (I,J) One-hour EdU indices in Sox9+ populations under control or DBZ treatment. Error bars are SEM. n = 3.
Figure 7.
Figure 7.
Ngn3 deficiency causes reduced cell replication and precocious loss of the plexus state. (A,B) S-phase indices in Sox9+ cells from Ngn3EGFP/+ and Ngn3EGFP/EGFP samples. (C) Quantification of A and B (E16.5) plus measurements at E13.5. Error bars are SEM. n = 2 E13.5 ([*] P = 0.0277); n = 3 E16.5 ([**] P = 0.0048) with 30% of dorsal pancreas scored, Student's t-test. (D,E) Dorsal pancreas from E14.5 Ngn3EGFP/+ and Ngn3EGFP/EGFP samples at E14.5. (Red arrowheads) Regions where the plexus is lost in Ngn3EGFP/EGFP animals compared with control; (green arrowheads) core locations where the plexus becomes dysmorphic in Ngn3EGFP/EGFP animals compared with control. (F) Quantification of the plexus-to-duct transformation in core Ngn3EGFP/+ and Ngn3EGFP/EGFP pancreata. Error bars are SEM. n = 3 all stages. (*) P < 0.01; (**) P = 0.119. The entire dorsal pancreas core was analyzed in serial thick sections (40 µm). (G) Analysis of precocious loss of the plexus at E16.0. (G) Regions a, b, and c in the cartoon correspond to the images in H–M. (HM) Muc1 and insulin immune detection in similar locations in Ngn3EGFP/+ and Ngn3EGFP/EGFP littermates. Bars: A,B, 20 μm; D,E, 50 μm; H–M, 40 μm.

Similar articles

Cited by

References

    1. Afelik S, Qu X, Hasrouni E, Bukys M, Deering T, Nieuwoudt S, Rogers W, MacDonald R, Jensen J. 2012. Notch-mediate patterning and cell fate allocation of pancreatic progenitor cells. Development 139: 1744–1753. - PMC - PubMed
    1. Ahnfelt-Ronne J, Jorgensen MC, Hald J, Madsen OD, Serup P, Hecksher-Sorensen J. 2007. An improved method for three-dimensional reconstruction of protein expression patterns in intact mouse and chicken embryos and organs. J Histochem Cytochem 55: 925–930. - PubMed
    1. Apelqvist A, Hao H, Sommer L, Beatus P, Anderson DJ, Honjo T, Hrabe de Angelis M, Lendahl U, Edlund H. 1999. Notch signaling controls pancreatic cell differentiation. Nature 400: 877–881. - PubMed
    1. Cheraghali A, Knaus E, Wiebe L. 1994. Bioavailability and pharmacokinetic parameter for 5-ethyl-2′-deoxyuridine. Antiviral Res 25: 259–267. - PubMed
    1. Cortijo C, Gouzi M, Tissir F, Grapin-Botton A. 2012. Planar cell polarity controls pancreatic beta cell differentiation and glucose homeostasis. Cell Rep 2: 1593–1606. - PMC - PubMed

Publication types

MeSH terms

LinkOut - more resources