. 2015 Dec;22(6):439-49.
doi: 10.1093/dnares/dsv025. Epub 2015 Oct 21.

AnABlast: a new in silico strategy for the genome-wide search of novel genes and fossil regions

Affiliations

AnABlast: a new in silico strategy for the genome-wide search of novel genes and fossil regions

Juan Jimenez et al. DNA Res. 2015 Dec.

Abstract

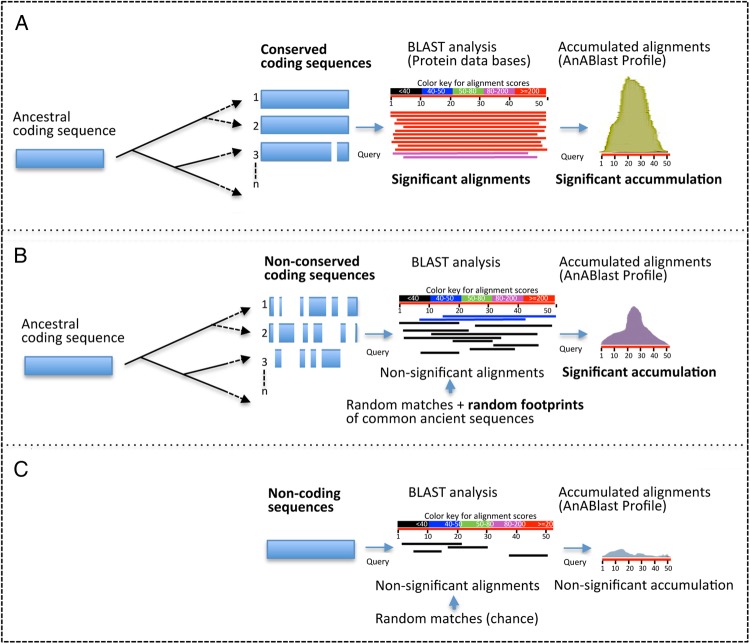
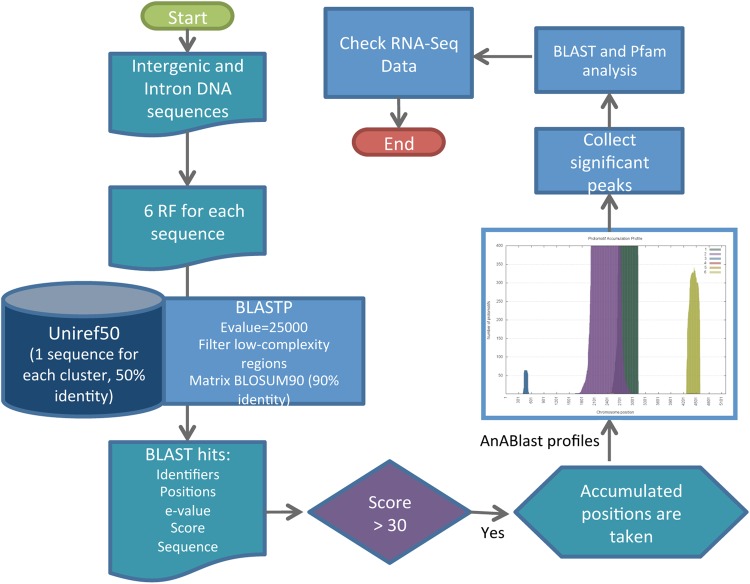
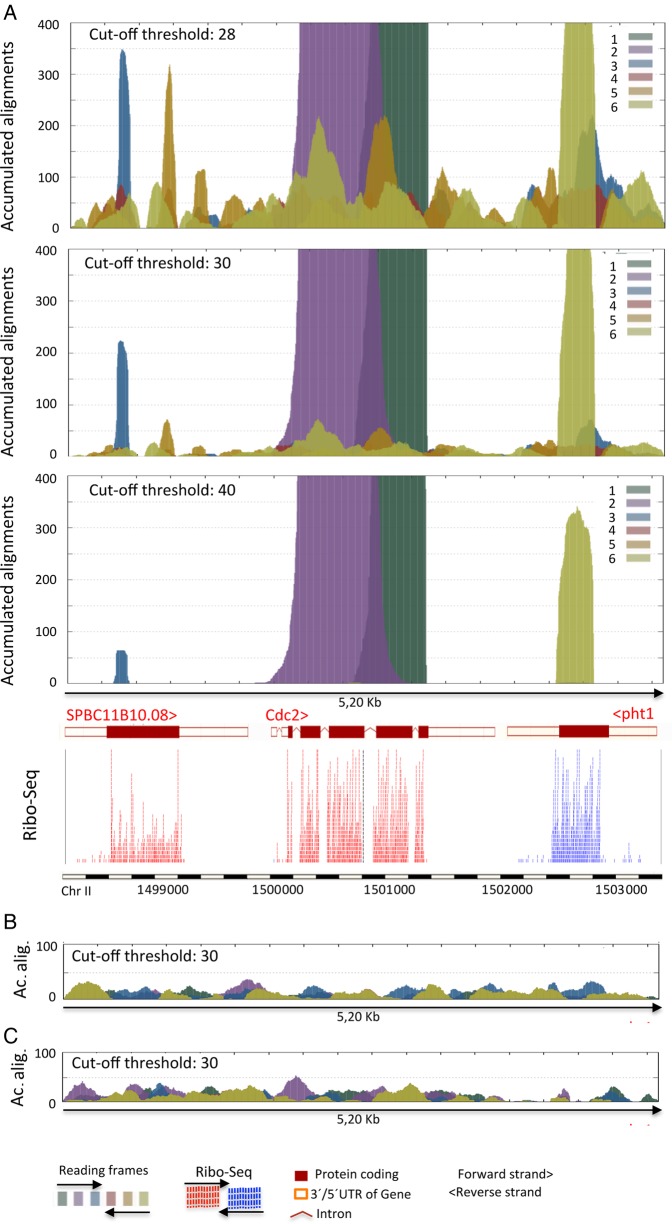
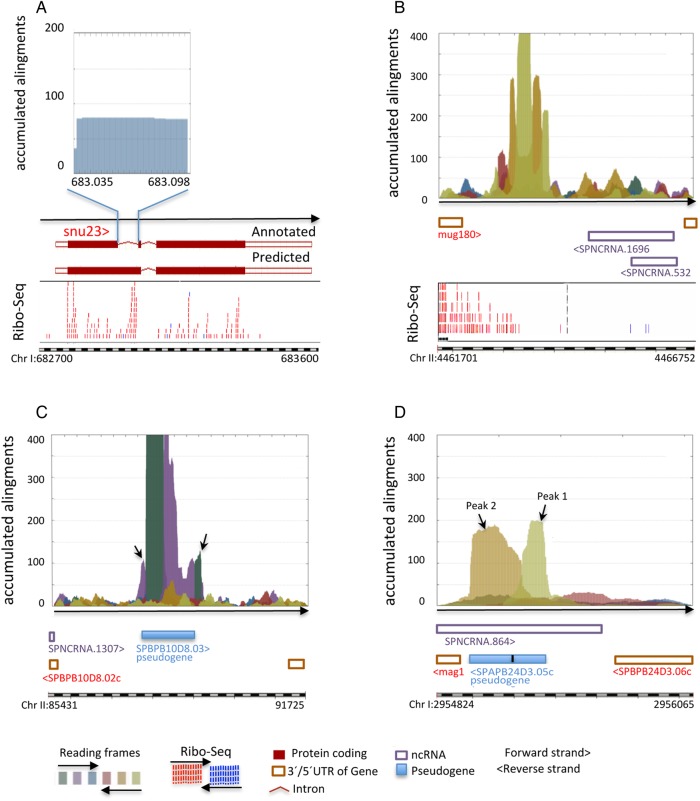
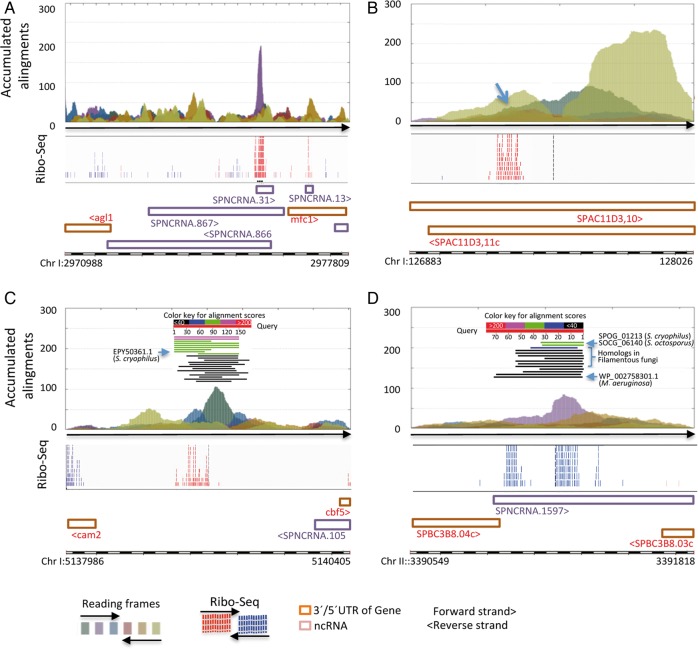
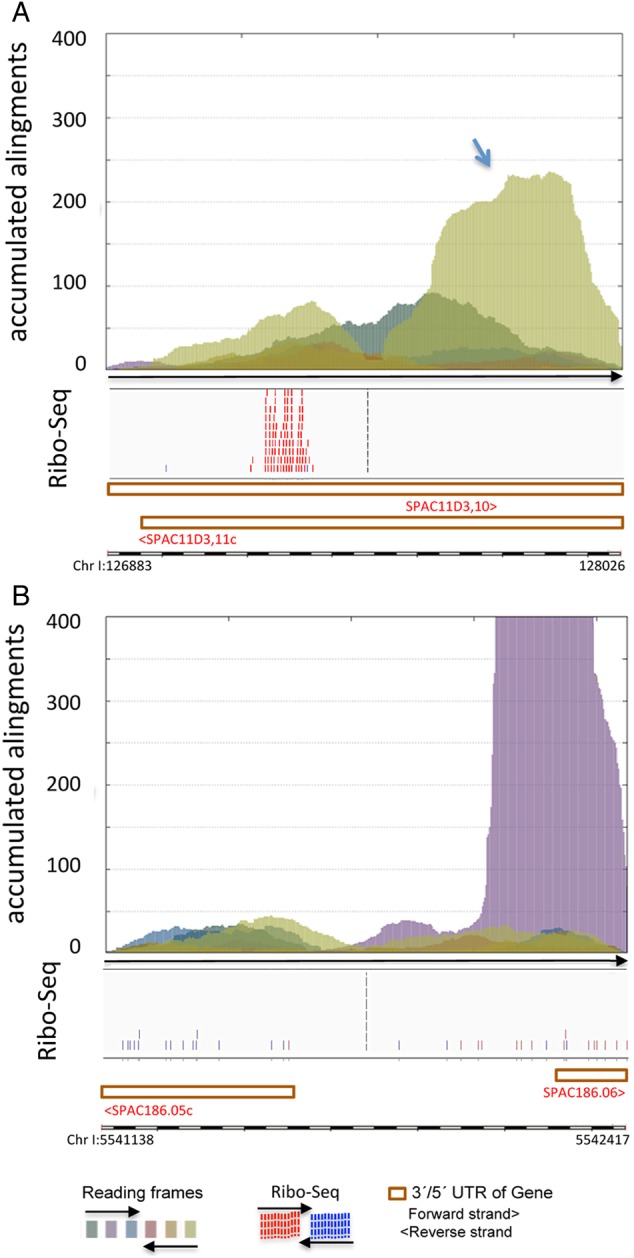
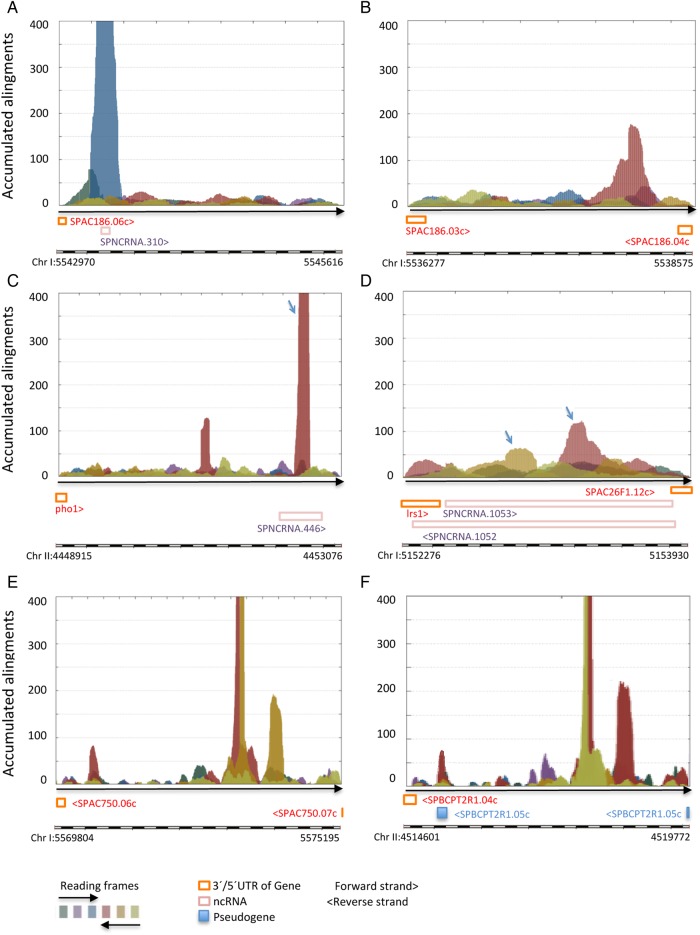
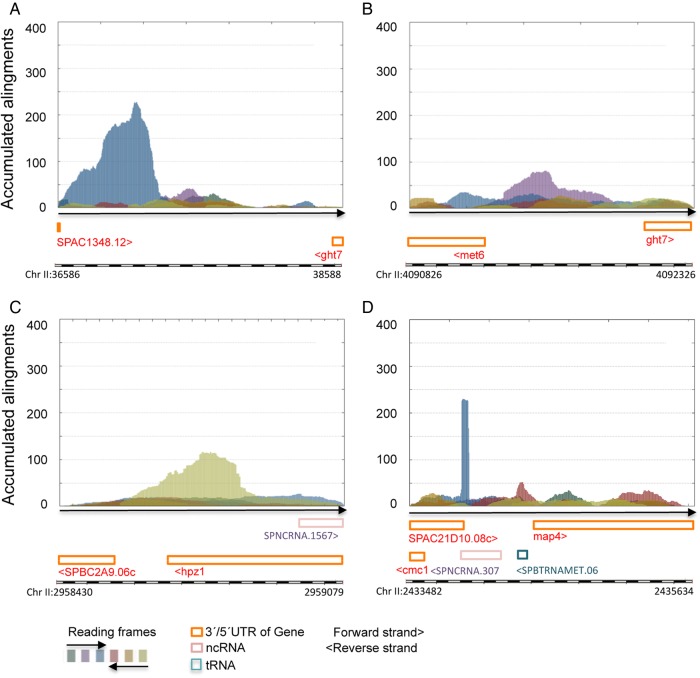
Genome annotation, assisted by computer programs, is one of the great advances in modern biology. Nevertheless, the in silico identification of small and complex coding sequences is still challenging. We observed that amino acid sequences inferred from coding-but rarely from non-coding-DNA sequences accumulated alignments in low-stringency BLAST searches, suggesting that this alignments accumulation could be used to highlight coding regions in sequenced DNA. To investigate this possibility, we developed a computer program (AnABlast) that generates profiles of accumulated alignments in query amino acid sequences using a low-stringency BLAST strategy. To validate this approach, all six-frame translations of DNA sequences between every two annotated exons of the fission yeast genome were analysed with AnABlast. AnABlast-generated profiles identified three new copies of known genes, and four new genes supported by experimental evidence. New pseudogenes, ancestral carboxyl- and amino-terminal subtractions, complex gene rearrangements, and ancient fragments of mitDNA and of bacterial origin, were also inferred. Thus, this novel in silico approach provides a powerful tool to uncover new genes, as well as fossil-coding sequences, thus providing insight into the evolutionary history of annotated genomes.

Keywords: Schizosaccharomyces pombe; fossil DNA sequences; genome evolution; in silico annotation tool; new genes.


Figures

Figure 1.
Figure 1.
Schematic representation of the AnABlast strategy for the identification of coding sequences. (A) In conserved proteins, conventional BLAST analysis of query sequences usually generates a number of significant alignments that allow the identification of coding sequences. The accumulation of these alignments along the query sequence (AnABlast profile) generates prominent peaks that also allow the easy identification of conserved coding regions. (B) In non-conserved sequences, BLAST search generates non-significant alignments, but AnABlast profiles highlight coding regions by the significant accumulation of these alignments, generated by random matches as well as from random footprints of common ancestors. (C) Non-coding sequences lack common ancestors in protein databases, and non-significant alignments may only occur by chance. In this case, alignments rarely accumulate in particular regions. This figure is available in black and white in print and in colour at DNA Research online.
Figure 2.
Figure 2.
AnABlast algorithm (schematized flux diagram) for coding sequence identification in a genome-wide search strategy. Amino acid sequences obtained from the six reading frames (RF) of each DNA inter-exon region are subjected to BLAST search against a protein database that minimizes redundancies (uniref50). After low-stringency alignment parameters (optimal bit score threshold: 30), hits are taken at each position of the query amino acid sequence, generating a profile of accumulated alignments along the sequence (AnABlast profile). Significant peaks in the generated profiles (higher than 70 in our S. pombe genome analysis) were selected, and the corresponding amino acid sequence further analysed by conventional BLAST and Pfam search. Ribo-Seq data in the identified genomic region of AnABlast peaks are also analysed. This figure is available in black and white in print and in colour at DNA Research online.
Figure 3.
Figure 3.
AnABlast profiles (accumulated alignments) in the Chr II: 1498400-1503600 genomic region containing the well-characterized cdc2 coding sequence and its flanking SPBC11B10.08 and pht1 genes (Pombase annotations). (A) Accumulation of alignments obtained in different score cut-off threshold from BLAST results (indicated) allows the establishment of optimal parameters for genome-wide search of coding sequences with AnABlast algorithms. Ribo-Seq data are used to confirm accuracy of AnABlast predictions from protein sequences encoded in the three possible reading frames in the forward (colour codes 1–3) and the reverse (colour codes 4–6) strand. (B) Representative AnABlast profile (score threshold: 30) obtained from a randomized DNA sequence of this genomic interval. (C) AnABlast profile (score threshold: 30) from the reverse DNA sequence (lacking biological significance in terms of protein coding) of this genomic interval. This figure is available in black and white in print and in colour at DNA Research online.
Figure 4.
Figure 4.
AnABlast profiles suggesting modifications in annotated intron and pseudogenes. (A) Profile generated in the first intron (Chr I: 683035-683098, forward strand) of the snu23 gene. Ribo-Seq data of the snu23 gene region are shown. (B) Profile identifying a DNA sequence encoding a putative dipeptide transmembrane transporter (Chr II: 4462621-4463890, reverse strand) similar to Schizosaccharomyces cryophilus EPY52281.1. RNA-Seq data of this region are shown. (C) Amino- and carboxyl-terminal expansions (forward strand in Chr II: 87554-87737 and Chr II: 89014-89176, respectively) highlighted by AnABlast analysis in the pseudogene SPBPB10D8.03 (arrows). The concatenated amino acid sequence of the different reading frame regions of this pseudogene, including carboxyl- and amino-terminal AnaBlast expansions, generated a protein 51% identical to a phthalate transporter of S. cryophilus. (D) AnABlast peaks (Chr I: 2955377-2955222 and Chr I: 29555220-29554983 respectively) (arrows) suggest changes in exons annotation in the pseudogene SPAPB24D3.05c (Chr I: 2955350-2955194 and Chr I: 2955191-2954983, respectively). Concatenated amino acid sequence of the reading frames predicted by AnABlast profiles produce a hypothetical pseudogene protein 65% identical to glyoxalase bacterial proteins. Pombase annotations and colour codes for reading frames of the analysed genomic intervals are shown. This figure is available in black and white in print and in colour at DNA Research online.
Figure 5.
Figure 5.
AnABlast profiles (accumulated alignments) identifying putative new genes. (A) AnaBlast peak at Chr I: 2975642-2975772 (forward strand) and (B) peak at Chr I: 127230-127316 (forward strand) (arrow) encode small peptides with no significant similarity to known proteins in databases. (C) Peak at Chr I: 5139023-5139195 (forward strand) identify a coding sequence similar to the SPOG_01629 protein of Schizosaccharomyces cryophilus. (D) Peak at Chr II: 3391178-3391413 (Chr II: 3391181-3391414, forward strand), uncovering a coding sequences with different degrees of similarity to protein SPOG_01213 from S. cryophilus and SOCG_06140 from Schizosaccharomyces octosporus, an hypothetical protein from a large number of filamentous fungi, and another one from the fresh water cyanobacteria Microcystis aeruginosa. (Schematic BLAST results are included). Ribo-Seq data, Pombase annotations, and colour codes for reading frames of the analysed genomic intervals are shown. This figure is available in black and white in print and in colour at DNA Research online.
Figure 6.
Figure 6.
AnABlast peaks uncovering evolutionary carboxyl- and amino-terminal subtractions in present genes. (A) AnABlast peak (arrow) at Chr I: 127.165-128.049 (reverse strand) located in the 3′UTR of SPAC11D3.11c reveals a carboxyl-terminal subtraction of this gene. (B) Peak at Chr I: 5542072-5542417 (forward strand), partially overlapping the 5′ UTR of SPAC186.06, uncovers an evolutionary amino-terminal subtraction of the corresponding gene. Ribo-Seq data, Pombase annotations, and colour codes for reading frames of the analysed genomic intervals are shown. This figure is available in black and white in print and in colour at DNA Research online.
Figure 7.
Figure 7.
Gene fragments identified by AnABlast profiles. (A) Peak in the Chr I: 5543318-5543498 interval (forward strand) uncovers a fragment of Tf1 protein (S. pombe ref gb|AAA35339.1|, e-value: 2e−15). (B) Peak in the Chr I: 5536277-5538575 interval (reverse strand) encodes a polypeptide sequence belonging to a MIP water channel (S. pombe ref|NP_592788.1|, e-value: 5e−12). (C) Main AnABlast peak (arrow) at Chr II: 4452616-4452379 encodes a chimeric fragment of amino acid permeases (Chr II: 4452616-4452443, S. pombe ref|NP_596849.1|. e-value: 2e−20) fused in frame to another one sharing significant identity to bacterial transposases (Chr II: 4452444-4452379, Desulfobacter postgatei ref|WP_004074224.1|, 73% identity). (D) Peaks (arrows) at the Chr I: 5153233-5153041 and Chr I: E 5153042-5152866 intervals (reverse strand) encode fragments of cell surface glycoproteins (S. pombe ref|NP_588570.2|, e-values of concatenated sequence: 3e−72). (E and F) Genomic subtelomeric regions (Chr I: 5569804-5575195 and Chr II: 4514601-4519772, respectively) showing similar AnABlast profiles highlighting fragments of RecQ type DNA helicase coding sequences (Schizosaccharomyces pombe ref|NP_595040.1|, e-value: 0,0) and DUF999 family proteins (SPAC212.04c, e-value: 0,0). Pombase annotations and colour codes for reading frames of the analysed genomic intervals are shown. This figure is available in black and white in print and in colour at DNA Research online.
Figure 8.
Figure 8.
Fossil-coding sequences predicted by AnABlast search. (A) AnABlast peak (Chr II: 36890-37298, forward strand) encodes a fragment of mitochondrial maturase protein 2 (fission yeast mitochondrion. Sequence ID: pir|S78197|. E-value: 5e−56). (B) Peak at Chr II: 4091456-4091554 (forward strand) codes for a polypeptide 58% identical to a domain of bacterial transposases (Bacillus mycoides ref: gb|KFN12866.1|). (C) Peak at 2958676-2958843 (reverse strand) encodes a partial sequence of bacterial trehalose synthase (Streptomyces chartreusis, ref|WP_010033287.1| e-value: 1e−17). (D) Peak at Chr II: 22433875-22433935 (forward strand) identifies a small peptide domain common to numerous cytochrome c oxidases (e-value for Hylarana sp: 1e−07). Pombase annotations and colour codes for reading frames of the analysed genomic intervals are shown. This figure is available in black and white in print and in colour at DNA Research online.

Similar articles

Cited by

References

    1. Nesvizhskii A.I. 2014, Proteogenomics: concepts, applications and computational strategies, Nat. Methods, 11, 1114–25. - PMC - PubMed
    1. Zhang M.Q. 2002, Computational prediction of eukaryotic protein-coding genes, Nat. Rev. Genet., 3, 698–709. - PubMed
    1. Altschul S.F., Madden T.L., Schäffer A.A. et al. . 1997, Gapped BLAST and PSI-BLAST: a new generation of protein database search programs, Nucleic Acids Res., 25, 3389–402. - PMC - PubMed
    1. Dargahi D., Baillie D., Pio F.. 2013, Bioinformatics analysis identify novel OB fold protein coding genes in C. elegans , PLoS One, 8, e62204. - PMC - PubMed
    1. Finn R.D., Mistry J., Tate J. et al. . 2010, The Pfam protein families database, Nucleic Acids Res., 38, D211–22. - PMC - PubMed

Publication types