

Shaped 3D singular spectrum analysis for quantifying gene expression, with application to the early zebrafish embryo
- PMID: 26495320
- PMCID: PMC4606214
- DOI: 10.1155/2015/986436
Shaped 3D singular spectrum analysis for quantifying gene expression, with application to the early zebrafish embryo
Abstract
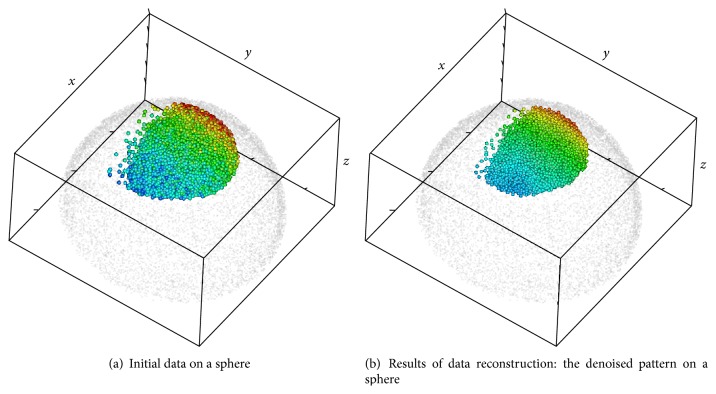
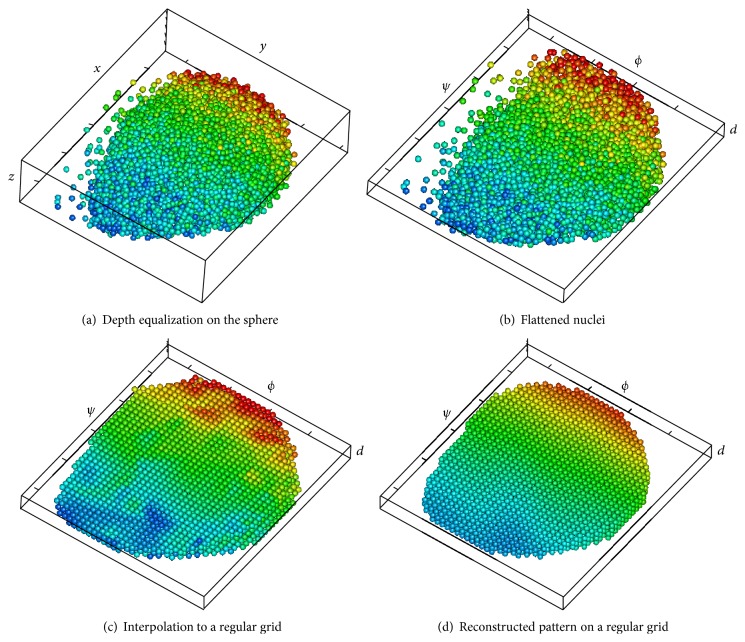
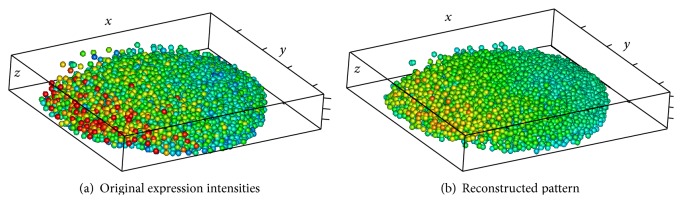
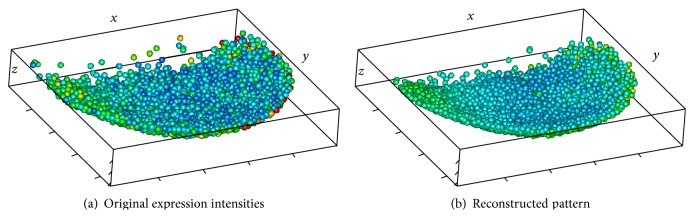
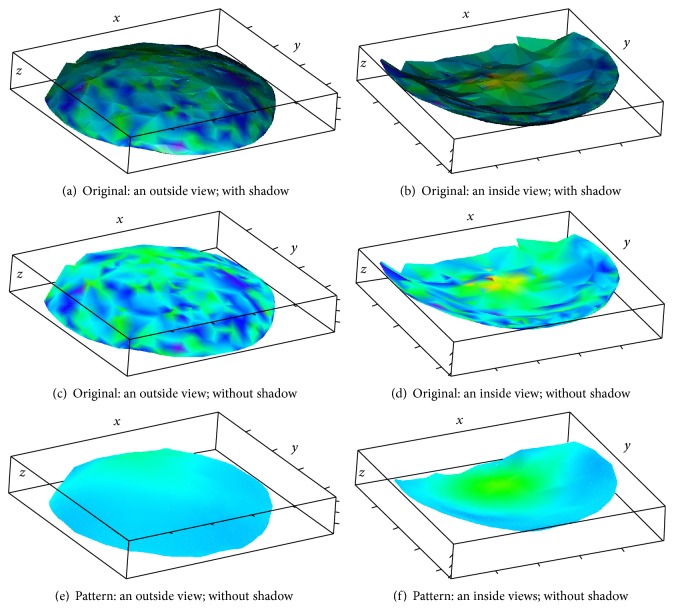
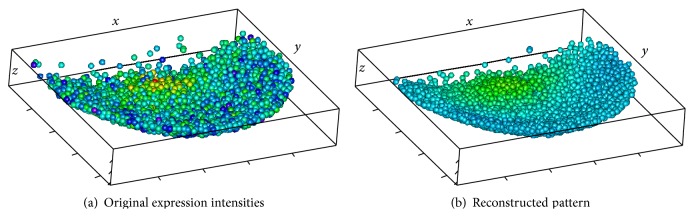
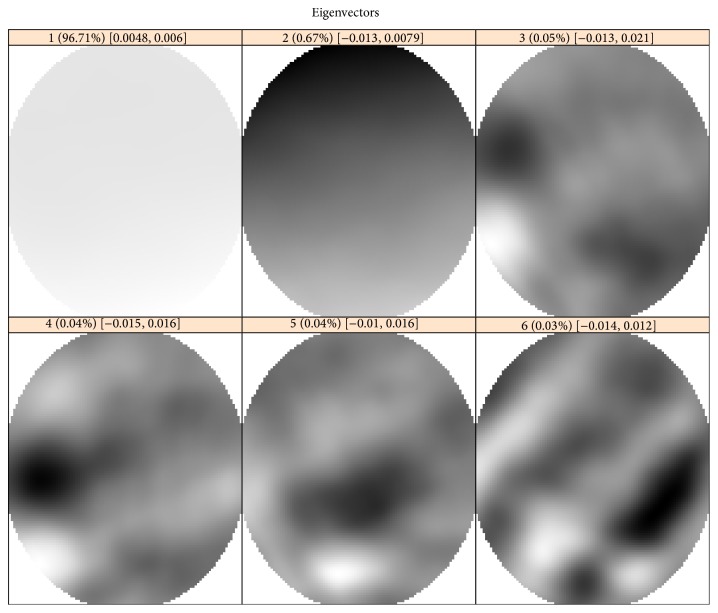
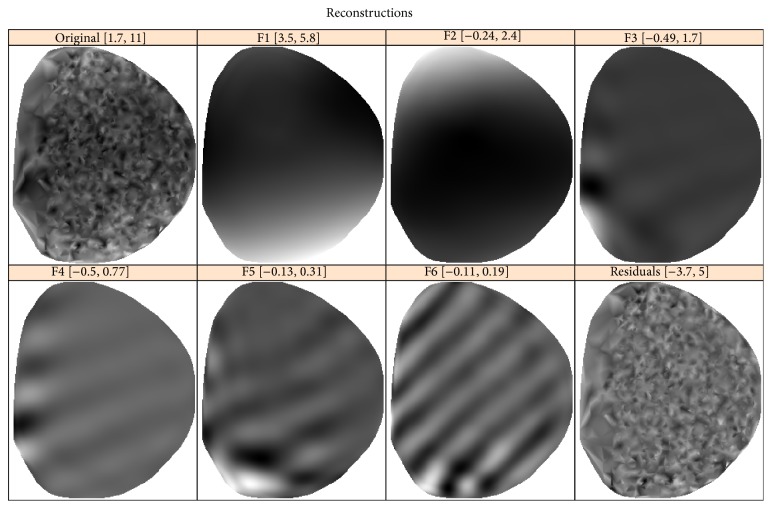
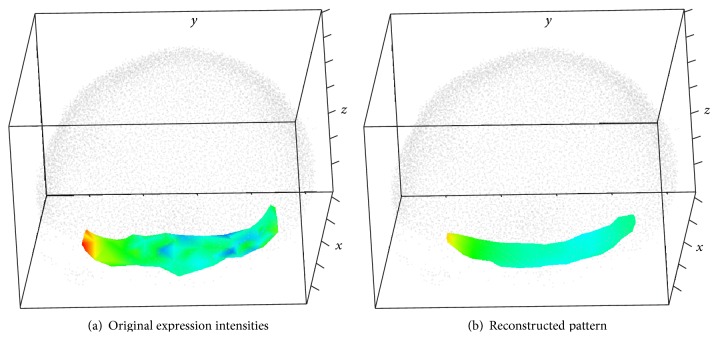
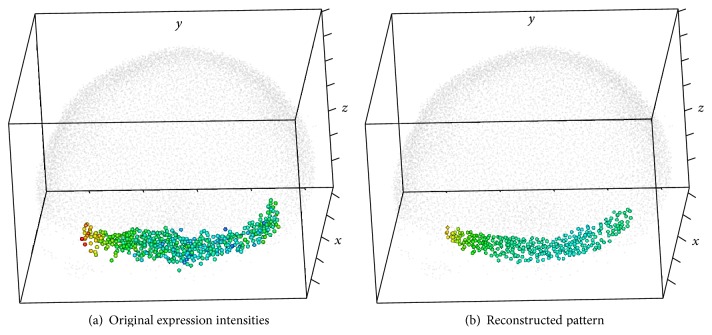
Recent progress in microscopy technologies, biological markers, and automated processing methods is making possible the development of gene expression atlases at cellular-level resolution over whole embryos. Raw data on gene expression is usually very noisy. This noise comes from both experimental (technical/methodological) and true biological sources (from stochastic biochemical processes). In addition, the cells or nuclei being imaged are irregularly arranged in 3D space. This makes the processing, extraction, and study of expression signals and intrinsic biological noise a serious challenge for 3D data, requiring new computational approaches. Here, we present a new approach for studying gene expression in nuclei located in a thick layer around a spherical surface. The method includes depth equalization on the sphere, flattening, interpolation to a regular grid, pattern extraction by Shaped 3D singular spectrum analysis (SSA), and interpolation back to original nuclear positions. The approach is demonstrated on several examples of gene expression in the zebrafish egg (a model system in vertebrate development). The method is tested on several different data geometries (e.g., nuclear positions) and different forms of gene expression patterns. Fully 3D datasets for developmental gene expression are becoming increasingly available; we discuss the prospects of applying 3D-SSA to data processing and analysis in this growing field.
Figures

Similar articles
-
Shaped singular spectrum analysis for quantifying gene expression, with application to the early Drosophila embryo.Biomed Res Int. 2015;2015:689745. doi: 10.1155/2015/689745. Epub 2015 Mar 19. Biomed Res Int. 2015. PMID: 25945341 Free PMC article.
-
3D+t morphological processing: applications to embryogenesis image analysis.IEEE Trans Image Process. 2012 Aug;21(8):3518-30. doi: 10.1109/TIP.2012.2197007. Epub 2012 May 1. IEEE Trans Image Process. 2012. PMID: 22562755
-
In vivo long-term continuous observation of gene expression in zebrafish embryo nerve systems by using harmonic generation microscopy and morphant technology.J Biomed Opt. 2008 Nov-Dec;13(6):064041. doi: 10.1117/1.3050423. J Biomed Opt. 2008. PMID: 19123687
-
Fluorescence molecular imaging.Annu Rev Biomed Eng. 2006;8:1-33. doi: 10.1146/annurev.bioeng.8.061505.095831. Annu Rev Biomed Eng. 2006. PMID: 16834550 Review.
-
Shedding light on the system: studying embryonic development with light sheet microscopy.Curr Opin Genet Dev. 2011 Oct;21(5):558-65. doi: 10.1016/j.gde.2011.07.003. Epub 2011 Aug 19. Curr Opin Genet Dev. 2011. PMID: 21862314 Review.
References
Publication types
MeSH terms
Grants and funding
LinkOut - more resources
Full Text Sources
Other Literature Sources
Research Materials
