Impact of Water Chemistry, Pipe Material and Stagnation on the Building Plumbing Microbiome
- PMID: 26495985
- PMCID: PMC4619671
- DOI: 10.1371/journal.pone.0141087
Impact of Water Chemistry, Pipe Material and Stagnation on the Building Plumbing Microbiome
Abstract
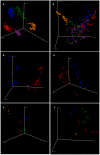
A unique microbiome establishes in the portion of the potable water distribution system within homes and other buildings (i.e., building plumbing). To examine its composition and the factors that shape it, standardized cold water plumbing rigs were deployed at the treatment plant and in the distribution system of five water utilities across the U.S. Three pipe materials (copper with lead solder, CPVC with brass fittings or copper/lead combined pipe) were compared, with 8 hour flush cycles of 10 minutes to simulate typical daily use patterns. High throughput Illumina sequencing of 16S rRNA gene amplicons was employed to profile and compare the resident bulk water bacteria and archaea. The utility, location of the pipe rig, pipe material and stagnation all had a significant influence on the plumbing microbiome composition, but the utility source water and treatment practices were dominant factors. Examination of 21 water chemistry parameters suggested that the total chlorine concentration, pH, P, SO42- and Mg were associated with the most of the variation in bulk water microbiome composition. Disinfectant type exerted a notably low-magnitude impact on microbiome composition. At two utilities using the same source water, slight differences in treatment approaches were associated with differences in rare taxa in samples. For genera containing opportunistic pathogens, Utility C samples (highest pH of 9-10) had the highest frequency of detection for Legionella spp. and lowest relative abundance of Mycobacterium spp. Data were examined across utilities to identify a true universal core, special core, and peripheral organisms to deepen insight into the physical and chemical factors that shape the building plumbing microbiome.
Conflict of interest statement
Figures


Similar articles
-
Effect of disinfectant, water age, and pipe material on occurrence and persistence of Legionella, mycobacteria, Pseudomonas aeruginosa, and two amoebas.Environ Sci Technol. 2012 Nov 6;46(21):11566-74. doi: 10.1021/es303212a. Epub 2012 Oct 25. Environ Sci Technol. 2012. PMID: 23046164
-
Impact of water heater temperature setting and water use frequency on the building plumbing microbiome.ISME J. 2017 Jun;11(6):1318-1330. doi: 10.1038/ismej.2017.14. Epub 2017 Mar 10. ISME J. 2017. PMID: 28282040 Free PMC article.
-
Impact of blending for direct potable reuse on premise plumbing microbial ecology and regrowth of opportunistic pathogens and antibiotic resistant bacteria.Water Res. 2019 Mar 15;151:75-86. doi: 10.1016/j.watres.2018.12.003. Epub 2018 Dec 11. Water Res. 2019. PMID: 30594092
-
Efficacy of chlorine-based disinfectants to control Legionella within premise plumbing systems.Water Res. 2024 Aug 1;259:121794. doi: 10.1016/j.watres.2024.121794. Epub 2024 May 25. Water Res. 2024. PMID: 38824796
-
A Critical Review on the Factors that Influence Opportunistic Premise Plumbing Pathogens: From Building Entry to Fixtures in Residences.Environ Sci Technol. 2023 Apr 25;57(16):6360-6372. doi: 10.1021/acs.est.2c04277. Epub 2023 Apr 10. Environ Sci Technol. 2023. PMID: 37036108 Review.
Cited by
-
Bacterial Communities in Concrete Reflect Its Composite Nature and Change with Weathering.mSystems. 2021 May 4;6(3):e01153-20. doi: 10.1128/mSystems.01153-20. mSystems. 2021. PMID: 33947799 Free PMC article.
-
Composition and Dynamics of Bacterial Communities in a Full-Scale Mineral Water Treatment Plant.Front Microbiol. 2019 Jul 24;10:1542. doi: 10.3389/fmicb.2019.01542. eCollection 2019. Front Microbiol. 2019. PMID: 31396165 Free PMC article.
-
Effect of heat shock on hot water plumbing microbiota and Legionella pneumophila control.Microbiome. 2018 Feb 9;6(1):30. doi: 10.1186/s40168-018-0406-7. Microbiome. 2018. PMID: 29426363 Free PMC article.
-
Characterization of the core microbiome in tobacco leaves during aging.Microbiologyopen. 2020 Mar;9(3):e984. doi: 10.1002/mbo3.984. Epub 2020 Jan 1. Microbiologyopen. 2020. PMID: 31893578 Free PMC article.
-
Impact of Pipe Material and Temperature on Drinking Water Microbiome and Prevalence of Legionella, Mycobacterium, and Pseudomonas Species.Microorganisms. 2023 Jan 31;11(2):352. doi: 10.3390/microorganisms11020352. Microorganisms. 2023. PMID: 36838316 Free PMC article.
References
-
- Berry D, Xi C, Raskin L. Microbial ecology of drinking water distribution systems. Curr Opin Biotechnol. 2006; 17(3): 297–232. - PubMed
-
- Holinger EP, Ross KA, Robertson CE, Stevens MJ, Kirk Harris J, Pace NR. Molecular analysis of point-of-use municipal drinking water microbiology. Water Res. 2014; 49(1): 225–235. - PubMed
-
- Wagner D, Chamberlain AHL. Microbiologically influenced copper corrosion in potable water with emphasis on practical relevance. Biodegradation. 1997; 8(3): 177–187.
Publication types
MeSH terms
Substances
LinkOut - more resources
Full Text Sources
Other Literature Sources
Medical
Molecular Biology Databases
Miscellaneous

