

Bisphenol A Disrupts HNF4α-Regulated Gene Networks Linking to Prostate Preneoplasia and Immune Disruption in Noble Rats
- PMID: 26496021
- PMCID: PMC4701889
- DOI: 10.1210/en.2015-1363
Bisphenol A Disrupts HNF4α-Regulated Gene Networks Linking to Prostate Preneoplasia and Immune Disruption in Noble Rats
Abstract
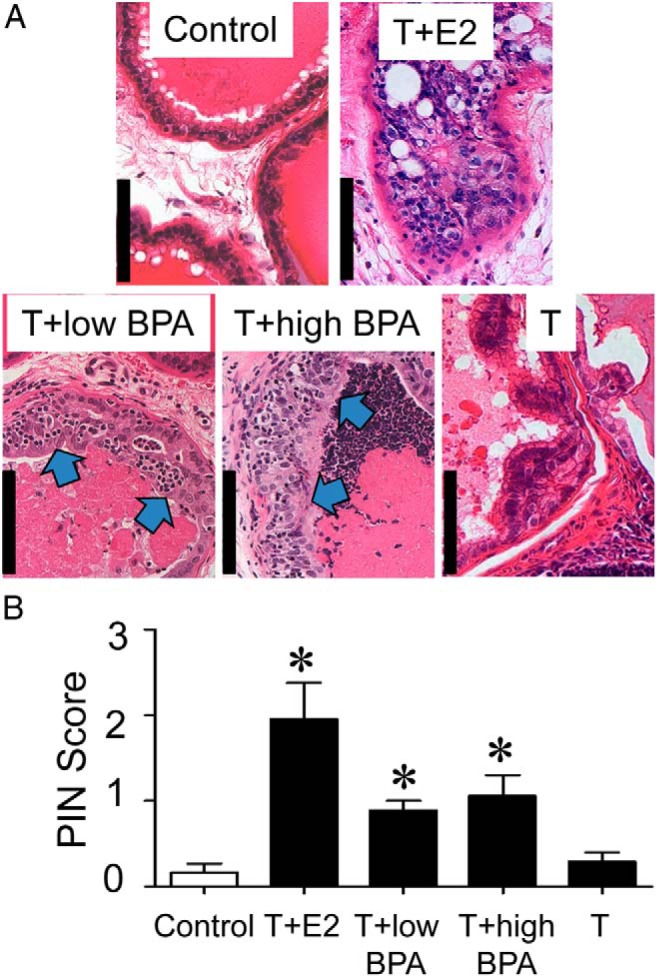
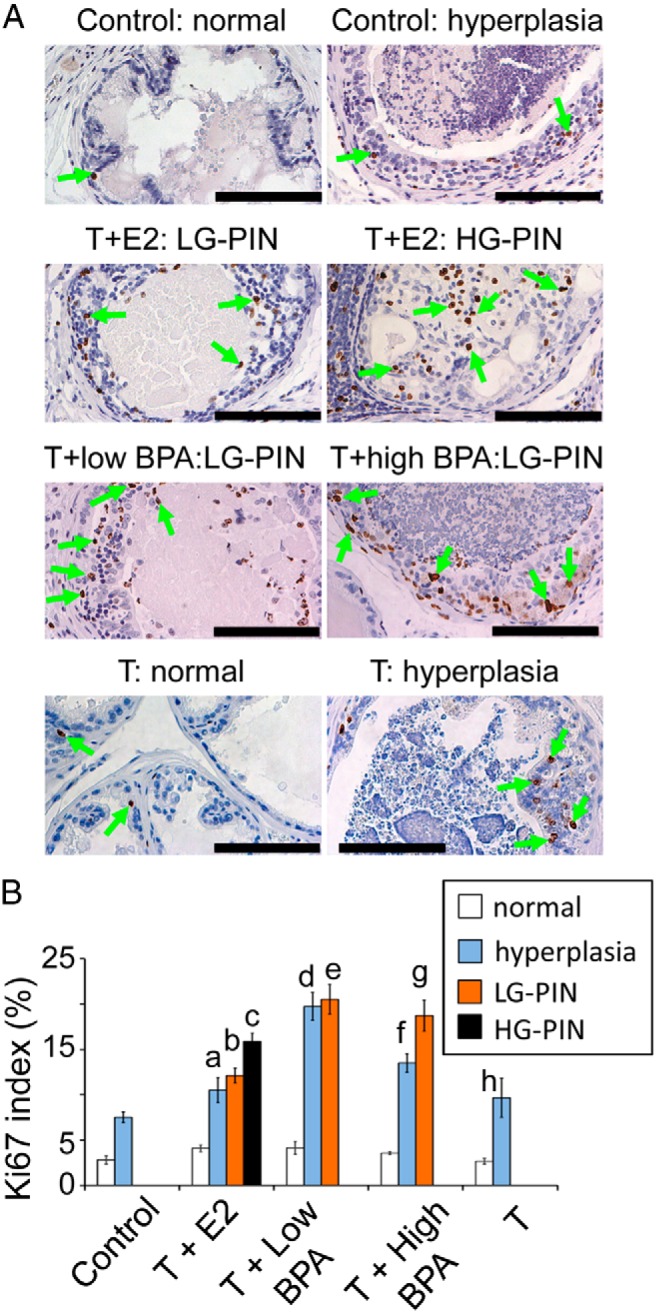
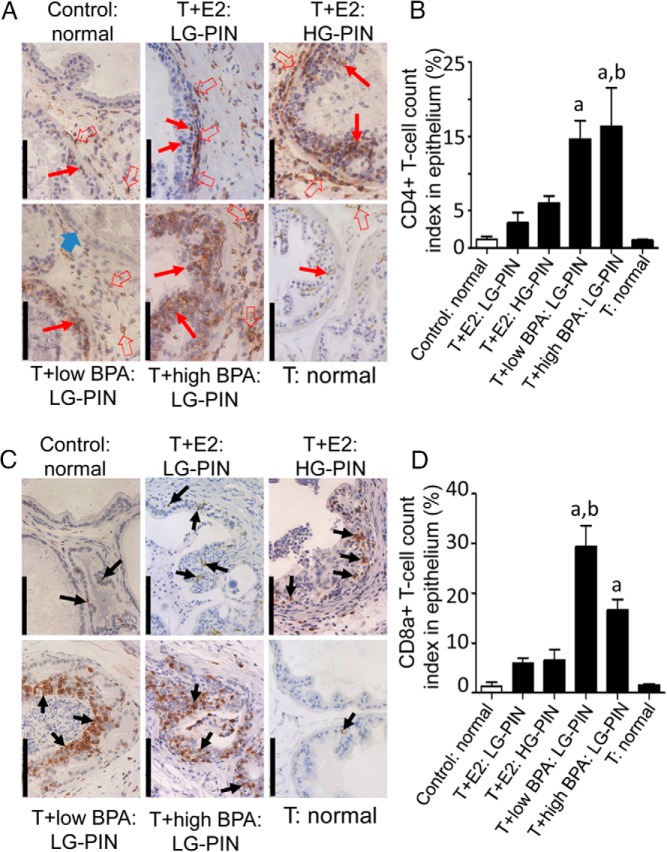
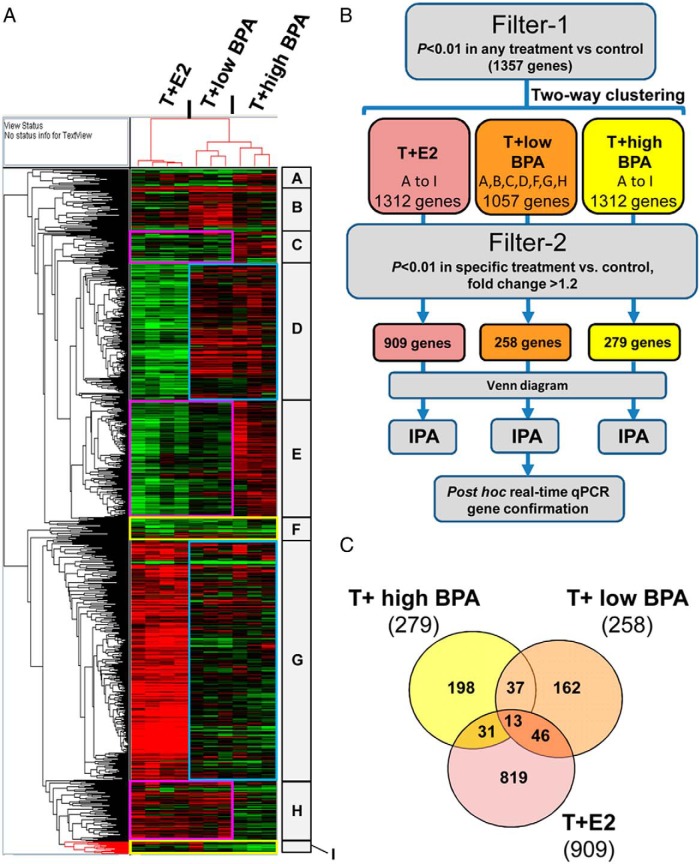
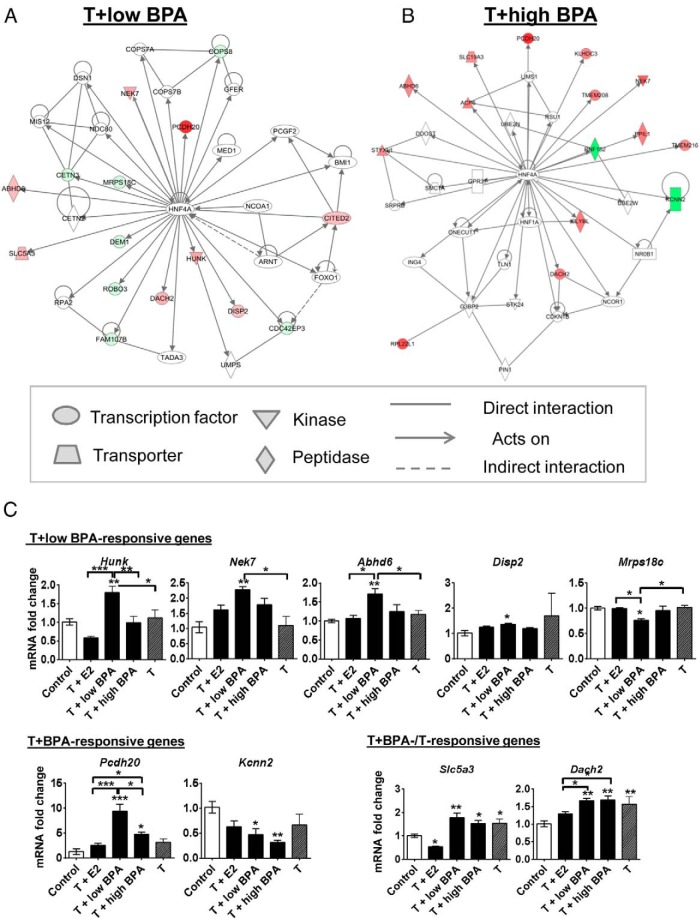
Exposure of humans to bisphenol A (BPA) is widespread and continuous. The effects of protracted exposure to BPA on the adult prostate have not been studied. We subjected Noble rats to 32 weeks of BPA (low or high dose) or 17β-estradiol (E2) in conjunction with T replenishment. T treatment alone or untreated groups were used as controls. Circulating T levels were maintained within the physiological range in all treatment groups, whereas the levels of free BPA were elevated in the groups treated with T+low BPA (1.06 ± 0.05 ng/mL, P < .05) and T+high BPA (10.37 ± 0.43 ng/mL, P < .01) when compared with those in both controls (0.1 ± 0.05 ng/mL). Prostatic hyperplasia, low-grade prostatic intraepithelial neoplasia (PIN), and marked infiltration of CD4+ and CD8+ T cells into the PIN epithelium (P < .05) were observed in the lateral prostates (LPs) of T+low/high BPA-treated rats. In contrast, only hyperplasia and high-grade PIN, but no aberrant immune responses, were found in the T+E2-treated LPs. Genome-wide transcriptome analysis in LPs identified differential changes between T+BPA vs T+E2 treatment. Expression of multiple genes in the regulatory network controlled by hepatocyte nuclear factor 4α was perturbed by the T+BPA but not by the T+E2 exposure. Collectively these findings suggest that the adult rat prostate, under a physiologically relevant T environment, is susceptible to BPA-induced transcriptomic reprogramming, immune disruption, and aberrant growth dysregulation in a manner distinct from those caused by E2. They are more relevant to our recent report of higher urinary levels BPA found in patients with prostate cancer than those with benign disease.
Figures
Similar articles
-
Evaluation of Bisphenol A (BPA) Exposures on Prostate Stem Cell Homeostasis and Prostate Cancer Risk in the NCTR-Sprague-Dawley Rat: An NIEHS/FDA CLARITY-BPA Consortium Study.Environ Health Perspect. 2018 Nov;126(11):117001. doi: 10.1289/EHP3953. Environ Health Perspect. 2018. PMID: 30387366 Free PMC article.
-
Oral exposure to low-dose bisphenol A aggravates testosterone-induced benign hyperplasia prostate in rats.Toxicol Ind Health. 2011 Oct;27(9):810-9. doi: 10.1177/0748233711399310. Epub 2011 Mar 17. Toxicol Ind Health. 2011. PMID: 21415097
-
Prostate Cancer Risk and DNA Methylation Signatures in Aging Rats following Developmental BPA Exposure: A Dose-Response Analysis.Environ Health Perspect. 2017 Jul 11;125(7):077007. doi: 10.1289/EHP1050. Environ Health Perspect. 2017. PMID: 28728135 Free PMC article.
-
Bisphenol A and human health: a review of the literature.Reprod Toxicol. 2013 Dec;42:132-55. doi: 10.1016/j.reprotox.2013.08.008. Epub 2013 Aug 30. Reprod Toxicol. 2013. PMID: 23994667 Review.
-
A systematic review of Bisphenol A "low dose" studies in the context of human exposure: a case for establishing standards for reporting "low-dose" effects of chemicals.Food Chem Toxicol. 2013 Dec;62:935-48. doi: 10.1016/j.fct.2013.07.007. Epub 2013 Jul 16. Food Chem Toxicol. 2013. PMID: 23867546
Cited by
-
DNA methylome changes by estradiol benzoate and bisphenol A links early-life environmental exposures to prostate cancer risk.Epigenetics. 2016 Sep;11(9):674-689. doi: 10.1080/15592294.2016.1208891. Epub 2016 Jul 14. Epigenetics. 2016. PMID: 27415467 Free PMC article.
-
Overexpression of DTX1 inhibits D-GalN/TNF-α-induced pyroptosis and inflammation in hepatocytes by regulating NLRP3 ubiquitination.Toxicol Res (Camb). 2024 Sep 23;13(5):tfae145. doi: 10.1093/toxres/tfae145. eCollection 2024 Oct. Toxicol Res (Camb). 2024. PMID: 39319341
-
Decoding the Influence of Obesity on Prostate Cancer and Its Transgenerational Impact.Nutrients. 2023 Nov 21;15(23):4858. doi: 10.3390/nu15234858. Nutrients. 2023. PMID: 38068717 Free PMC article. Review.
-
Characterization of an Abiraterone Ultraresponsive Phenotype in Castration-Resistant Prostate Cancer Patient-Derived Xenografts.Clin Cancer Res. 2017 May 1;23(9):2301-2312. doi: 10.1158/1078-0432.CCR-16-2054. Epub 2016 Dec 19. Clin Cancer Res. 2017. PMID: 27993966 Free PMC article.
-
An epigenome-wide analysis of cord blood DNA methylation reveals sex-specific effect of exposure to bisphenol A.Sci Rep. 2019 Aug 26;9(1):12369. doi: 10.1038/s41598-019-48916-5. Sci Rep. 2019. PMID: 31451752 Free PMC article.
References
-
- Dodds EC, Fitzgerald MEH, Lawson W. Oestrogenic activity of some hydrocarbon derivatives of ethylene. Nature. 1937;140:772.
-
- Rubin BS. Bisphenol A: an endocrine disruptor with widespread exposure and multiple effects. J Steroid Biochem Mol Biol. 2011;127:27–34. - PubMed
-
- Vandenberg LN, Hauser R, Marcus M, Olea N, Welshons WV. Human exposure to bisphenol A (BPA). Reprod Toxicol. 2007;24:139–177. - PubMed
Publication types
MeSH terms
Substances
Grants and funding
- U54HL127624/HL/NHLBI NIH HHS/United States
- U01 ES020988/ES/NIEHS NIH HHS/United States
- RC2ES018758/ES/NIEHS NIH HHS/United States
- RC2 ES018789/ES/NIEHS NIH HHS/United States
- R21CA156042/CA/NCI NIH HHS/United States
- U54 HL127624/HL/NHLBI NIH HHS/United States
- R01 ES015584/ES/NIEHS NIH HHS/United States
- U01ES019480/ES/NIEHS NIH HHS/United States
- R01CA015776/CA/NCI NIH HHS/United States
- R01 CA112532/CA/NCI NIH HHS/United States
- R01CA112532/CA/NCI NIH HHS/United States
- P30 ES006096/ES/NIEHS NIH HHS/United States
- R01 CA015776/CA/NCI NIH HHS/United States
- RC2 ES018758/ES/NIEHS NIH HHS/United States
- U01ES020988/ES/NIEHS NIH HHS/United States
- R21 CA156042/CA/NCI NIH HHS/United States
- P30ES006096/ES/NIEHS NIH HHS/United States
- I01 BX000675/BX/BLRD VA/United States
- RC2ES018789/ES/NIEHS NIH HHS/United States
- R01ES015584/ES/NIEHS NIH HHS/United States
- U01 ES019480/ES/NIEHS NIH HHS/United States
LinkOut - more resources
Full Text Sources
Other Literature Sources
Medical
Molecular Biology Databases
Research Materials
