. 2015 Oct 23;10(10):e0140644.
doi: 10.1371/journal.pone.0140644. eCollection 2015.

ARK: Aggregation of Reads by K-Means for Estimation of Bacterial Community Composition

Affiliations

ARK: Aggregation of Reads by K-Means for Estimation of Bacterial Community Composition

David Koslicki et al. PLoS One. .

Abstract

Motivation: Estimation of bacterial community composition from high-throughput sequenced 16S rRNA gene amplicons is a key task in microbial ecology. Since the sequence data from each sample typically consist of a large number of reads and are adversely impacted by different levels of biological and technical noise, accurate analysis of such large datasets is challenging.

Results: There has been a recent surge of interest in using compressed sensing inspired and convex-optimization based methods to solve the estimation problem for bacterial community composition. These methods typically rely on summarizing the sequence data by frequencies of low-order k-mers and matching this information statistically with a taxonomically structured database. Here we show that the accuracy of the resulting community composition estimates can be substantially improved by aggregating the reads from a sample with an unsupervised machine learning approach prior to the estimation phase. The aggregation of reads is a pre-processing approach where we use a standard K-means clustering algorithm that partitions a large set of reads into subsets with reasonable computational cost to provide several vectors of first order statistics instead of only single statistical summarization in terms of k-mer frequencies. The output of the clustering is then processed further to obtain the final estimate for each sample. The resulting method is called Aggregation of Reads by K-means (ARK), and it is based on a statistical argument via mixture density formulation. ARK is found to improve the fidelity and robustness of several recently introduced methods, with only a modest increase in computational complexity.

Availability: An open source, platform-independent implementation of the method in the Julia programming language is freely available at https://github.com/dkoslicki/ARK. A Matlab implementation is available at http://www.ee.kth.se/ctsoftware.


Conflict of interest statement

Competing Interests: L.J.F. received funding in the form of salary from Illumina Cambridge Ltd. This does not alter the authors’ adherence to all the PLOS ONE policies on sharing data and materials.

Figures

Fig 1
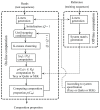
Fig 1. A flow-chart of the ARK method.
Fig 2
Fig 2. Results for the random K-means clustering on the simulated data.
Mean VD error at the genus level as a function of the number of clusters. Note the improvement that ARK contributes to each method.
Fig 3
Fig 3. Results for the random K-means clustering on the simulated data.
Mean execution time increase (factor given in comparison to running SEK or Quikr in the absence of ARK) as a function of number of clusters. The dashed line represents a line with slope 1.
Fig 4
Fig 4. Comparison of the underlying algorithms with and without ARK.
Results are for the random K-means clustering on the simulated data when fixing the number of clusters to 75. Mean VD error at the genus level. Included for comparison are results for RDP’s NBC (compare to Fig 2(b) of [3]).
Fig 5
Fig 5. Comparison of the underlying algorithms with and without ARK.
Results are for the random K-means clustering on the simulated data when fixing the number of clusters to 75. Boxplot of the individual simulated sample execution times. Mean execution times for Quikr and ARK Quikr were 1.75 seconds and 4.71 minutes, while for SEK and ARK SEK they were 21.26 seconds and 19.21 minutes respectively. Mean execution time for RDP’s NBC was 38.19 minutes.
Fig 6
Fig 6. Total execution time for each method on the 28 samples of real biological data.
Fig 7
Fig 7. PCoA plots using the Jensen-Shannon divergence for RDP’s NBC.
Fig 8
Fig 8. PCoA plots using the Jensen-Shannon divergence for ARK SEK.
Fig 9
Fig 9. ARK Quikr PCoA plots (using the Jensen-Shannon divergence) on the real biological data.
In this case, we have labeling by body site. Note the clustering.
Fig 10
Fig 10. ARK Quikr PCoA plots (using the Jensen-Shannon divergence) on the real biological data.
In this case, we have labeling by variable region. Note the clustering.

Similar articles

Cited by

  • A survey of k-mer methods and applications in bioinformatics.
    Moeckel C, Mareboina M, Konnaris MA, Chan CSY, Mouratidis I, Montgomery A, Chantzi N, Pavlopoulos GA, Georgakopoulos-Soares I. Moeckel C, et al. Comput Struct Biotechnol J. 2024 May 21;23:2289-2303. doi: 10.1016/j.csbj.2024.05.025. eCollection 2024 Dec. Comput Struct Biotechnol J. 2024. PMID: 38840832 Free PMC article. Review.
  • Critical Assessment of Metagenome Interpretation-a benchmark of metagenomics software.
    Sczyrba A, Hofmann P, Belmann P, Koslicki D, Janssen S, Dröge J, Gregor I, Majda S, Fiedler J, Dahms E, Bremges A, Fritz A, Garrido-Oter R, Jørgensen TS, Shapiro N, Blood PD, Gurevich A, Bai Y, Turaev D, DeMaere MZ, Chikhi R, Nagarajan N, Quince C, Meyer F, Balvočiūtė M, Hansen LH, Sørensen SJ, Chia BKH, Denis B, Froula JL, Wang Z, Egan R, Don Kang D, Cook JJ, Deltel C, Beckstette M, Lemaitre C, Peterlongo P, Rizk G, Lavenier D, Wu YW, Singer SW, Jain C, Strous M, Klingenberg H, Meinicke P, Barton MD, Lingner T, Lin HH, Liao YC, Silva GGZ, Cuevas DA, Edwards RA, Saha S, Piro VC, Renard BY, Pop M, Klenk HP, Göker M, Kyrpides NC, Woyke T, Vorholt JA, Schulze-Lefert P, Rubin EM, Darling AE, Rattei T, McHardy AC. Sczyrba A, et al. Nat Methods. 2017 Nov;14(11):1063-1071. doi: 10.1038/nmeth.4458. Epub 2017 Oct 2. Nat Methods. 2017. PMID: 28967888 Free PMC article.
  • The application of machine learning in clinical microbiology and infectious diseases.
    Xu C, Zhao LY, Ye CS, Xu KC, Xu KY. Xu C, et al. Front Cell Infect Microbiol. 2025 May 1;15:1545646. doi: 10.3389/fcimb.2025.1545646. eCollection 2025. Front Cell Infect Microbiol. 2025. PMID: 40375898 Free PMC article. Review.
  • Assessing taxonomic metagenome profilers with OPAL.
    Meyer F, Bremges A, Belmann P, Janssen S, McHardy AC, Koslicki D. Meyer F, et al. Genome Biol. 2019 Mar 4;20(1):51. doi: 10.1186/s13059-019-1646-y. Genome Biol. 2019. PMID: 30832730 Free PMC article.

References

    1. Wang Q, Garrity GM, Tiedje JM, Cole JR. Naïve Bayesian Classifier for Rapid Assignment of rRNA Sequences into the New Bacterial Taxonomy. Appl Environ Microbiol. 2007;73(16):5261–5267. 10.1128/AEM.00062-07 - DOI - PMC - PubMed
    1. Meinicke P, Aßhauer KP, Lingner T. Mixture models for analysis of the taxonomic composition of metagenomes. Bioinformatics. 2011;27(12):1618–1624. 10.1093/bioinformatics/btr266 - DOI - PMC - PubMed
    1. Koslicki D, Foucart S, Rosen G. Quikr: a method for rapid reconstruction of bacterial communities via compressive sensing. Bioinformatics. 2013;29(17):2096–2102. 10.1093/bioinformatics/btt336 - DOI - PubMed
    1. Ong SH, Kukkillaya VU, Wilm A, Lay C, Ho EXP, Low L, et al. Species Identification and Profiling of Complex Microbial Communities Using Shotgun Illumina Sequencing of 16S rRNA Amplicon Sequences. PLoS One. 2013;8(4):e60811 10.1371/journal.pone.0060811 - DOI - PMC - PubMed
    1. Dröge J, Gregor I, McHardy A. Taxator-tk: Precise Taxonomic Assignment of Metagenomes by Fast Approximation of Evolutionary Neighborhoods. Bioinformatics. 2014;31(6):817–824. 10.1093/bioinformatics/btu745 - DOI - PMC - PubMed

Publication types