. 2015 Oct 23;10(10):e0140950.
doi: 10.1371/journal.pone.0140950. eCollection 2015.

A Design Pattern for Decentralised Decision Making

Affiliations

A Design Pattern for Decentralised Decision Making

Andreagiovanni Reina et al. PLoS One. .

Abstract

The engineering of large-scale decentralised systems requires sound methodologies to guarantee the attainment of the desired macroscopic system-level behaviour given the microscopic individual-level implementation. While a general-purpose methodology is currently out of reach, specific solutions can be given to broad classes of problems by means of well-conceived design patterns. We propose a design pattern for collective decision making grounded on experimental/theoretical studies of the nest-site selection behaviour observed in honeybee swarms (Apis mellifera). The way in which honeybee swarms arrive at consensus is fairly well-understood at the macroscopic level. We provide formal guidelines for the microscopic implementation of collective decisions to quantitatively match the macroscopic predictions. We discuss implementation strategies based on both homogeneous and heterogeneous multiagent systems, and we provide means to deal with spatial and topological factors that have a bearing on the micro-macro link. Finally, we exploit the design pattern in two case studies that showcase the viability of the approach. Besides engineering, such a design pattern can prove useful for a deeper understanding of decision making in natural systems thanks to the inclusion of individual heterogeneities and spatial factors, which are often disregarded in theoretical modelling.


Conflict of interest statement

Competing Interests: The authors have declared that no competing interests exist.

Figures

Fig 1
Fig 1. Probabilistic Finite State Machines (PFSMs) describing the microscopic behaviour of an agent in average.
Here, the notation Pλi is a shorthand for Pλ(vi) (A) PFSM describing the basic commitment dynamics. Spontaneous transitions are represented by solid lines, interactive transitions by dashed lines. For a complete version with n + 1 states, see panel A in S1 Fig (B) PFSM describing the dynamics of activity change as agents switch from latent to interactive states. Latent states are indicated in grey, while changes in the activity state are represented by dash-dotted arrows. (C) PFSM describing the coupled dynamics of commitment and activity change. For a complete version with 2(n + 1) states, see panel B in S1 Fig.
Fig 2
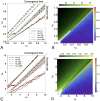
Fig 2. Collective decisions on a fully-connected network: comparison between the micro and the macro dynamics and scaling properties.
(A,C) Comparison between the stochastic finite-size macroscopic model (black lines) and the multiagent implementation with both the homogeneous strategy (red lines) and the heterogenous strategy (green lines). Results are displayed for varying system size N. For each possible configuration (v A, v B), 500 independent runs are performed. We show results for configurations with effectivity E>0.7. The plot is divided in two parts: in the bottom-right triangle, we consider the success rate S for each configuration (v A, v B), where v Av B. For each group size N, we show the isolines at S=0.9. The gray triangle indicates quality value pairs below the target resolution R = 0.15 (i.e., configurations in which the two options are considered equivalent). In the top-left half of the plot, we consider the convergence time C for each configuration (v A, v B), where v Bv A (i.e., the symmetric problems with respect to the bottom-right plot). For each group size N, we show the isolines at C=C^. (B, D) Scaling of the convergence time C with the system size N. For each configuration (v A, v B), we fit the curve C=bNa and we show the heat-map for the fitted coefficient a (see the bottom-right triangle showing the coefficient value for each configuration (v A, v B), v Av B) and b (see the top-left triangle showing the coefficient value for symmetric configurations (v A, v B), v Bv A) across the decision space. Also in this case we show only configurations where E>0.7 for all N, and the white space indicates configurations with low effectivity. (A,B) Results for case-study 1A with v i ∈ [0, 1], γ i = 0.6v i, α i = 0, ρ i = 0.1v i, σ i = 1 and i ∈ {A, B}, C^=50s. (C,D) Results for case-study 1B with v i ∈ [1, 10], γ i = ρ i = v i, α i = 1/v i, σ i = 10 and i ∈ {A, B}, C^=1s.
Fig 3
Fig 3. Collective decisions in a search and exploration problem: comparison between the micro and the macro dynamics.
The state space of the system is presented as a ternary plot characterised by ΨU + ΨA + ΨB = 1, so that vertices correspond to fully-uncommitted or fully-committed populations. Macroscopic dynamics are indicated by trajectories and equilibrium points from the ODE model of Eq (1), parametrised according to the specific configuration. The bold yellow trajectory indicates the behaviour starting from a fully-uncommitted population (ΨU = 1). Stable equilibrium points are indicated as blue empty circles, while unstable points are indicated as green empty diamonds. The density map in the background represents the results of homogeneous multiagent simulations (1000 runs). The inset shows the success rate S for macroscopic Gillespie simulations (white bars) and multiagent simulations (homogeneous in light gray and heterogeneous in dark grey). (A) Micro-macro link for a decision problem in which the best option is also the farthest one (v A = 0.7 < v B = 1 and d A = 1.5 m < d B = 2.5 m). The magnify-glass effect allows to appreciate the close correspondence between the stable point predicted by the macroscopic model and the results from the multiagent simulations. (B) Micro-macro link for a completely symmetric decision problem (v A = v B = 1 and d A = d B = 2.5 m).

References

    1. Liu YY, Slotine JJ, Barabási AL. Controllability of complex networks. Nature. 2011;473(7346):167–173. - PubMed
    1. Helbing D. Globally networked risks and how to respond. Nature. 2014;497(7447):51–59. 10.1038/nature12047 - DOI - PubMed
    1. Lee EA, Hartmann B, Kubiatowicz J, Simunic Rosing T, Wawrzynek J, Wessel D, et al. The Swarm at the Edge of the Cloud. IEEE Design & Test. 2014;31(3):8–20. 10.1109/MDAT.2014.2314600 - DOI
    1. Couzin ID. Collective cognition in animal groups. Trends Cogn Sci. 2009;13(1):36–43. 10.1016/j.tics.2008.10.002 - DOI - PubMed
    1. Baronchelli A, Ferrer-i-Cancho R, Pastor-Satorras R, Chater N, Christiansen MH. Networks in Cognitive Science. Trends Cogn Sci. 2013;17(7):348–360. 10.1016/j.tics.2013.04.010 - DOI - PubMed

Publication types

LinkOut - more resources