. 2015 Oct 23;9(10):e0004186.
doi: 10.1371/journal.pntd.0004186. eCollection 2015.

Monitoring of the Parasite Load in the Digestive Tract of Rhodnius prolixus by Combined qPCR Analysis and Imaging Techniques Provides New Insights into the Trypanosome Life Cycle

Affiliations

Monitoring of the Parasite Load in the Digestive Tract of Rhodnius prolixus by Combined qPCR Analysis and Imaging Techniques Provides New Insights into the Trypanosome Life Cycle

Felipe de Almeida Dias et al. PLoS Negl Trop Dis. .

Abstract

Background: Here we report the monitoring of the digestive tract colonization of Rhodnius prolixus by Trypanosoma cruzi using an accurate determination of the parasite load by qPCR coupled with fluorescence and bioluminescence imaging (BLI). These complementary methods revealed critical steps necessary for the parasite population to colonize the insect gut and establish vector infection.

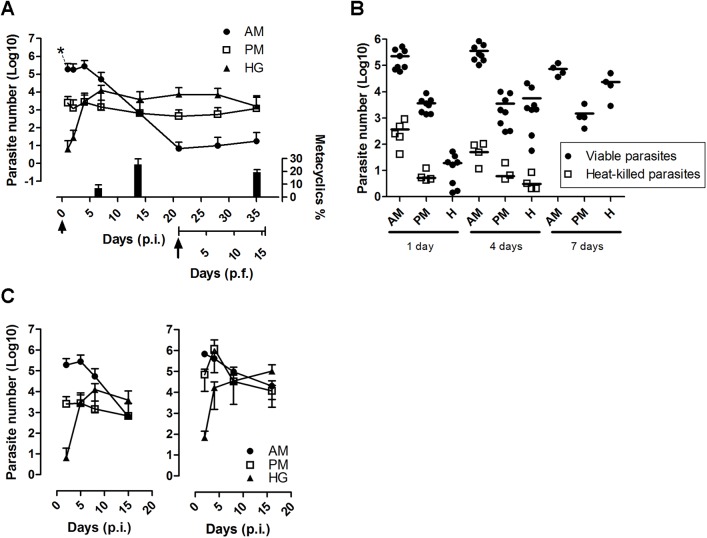
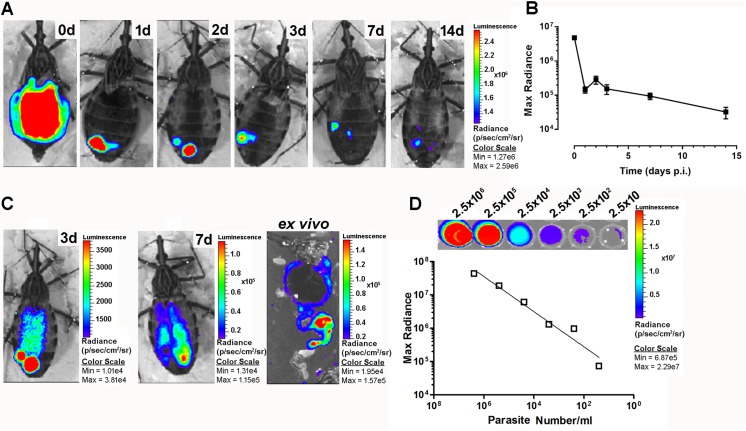
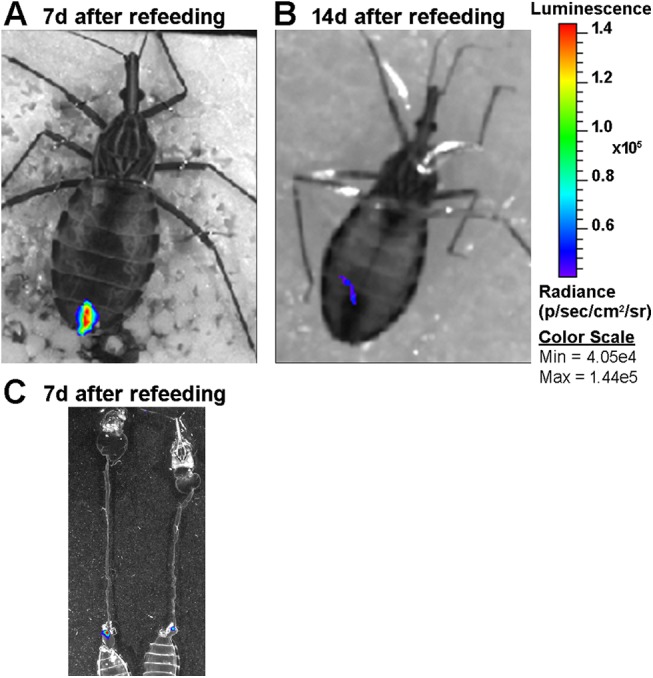
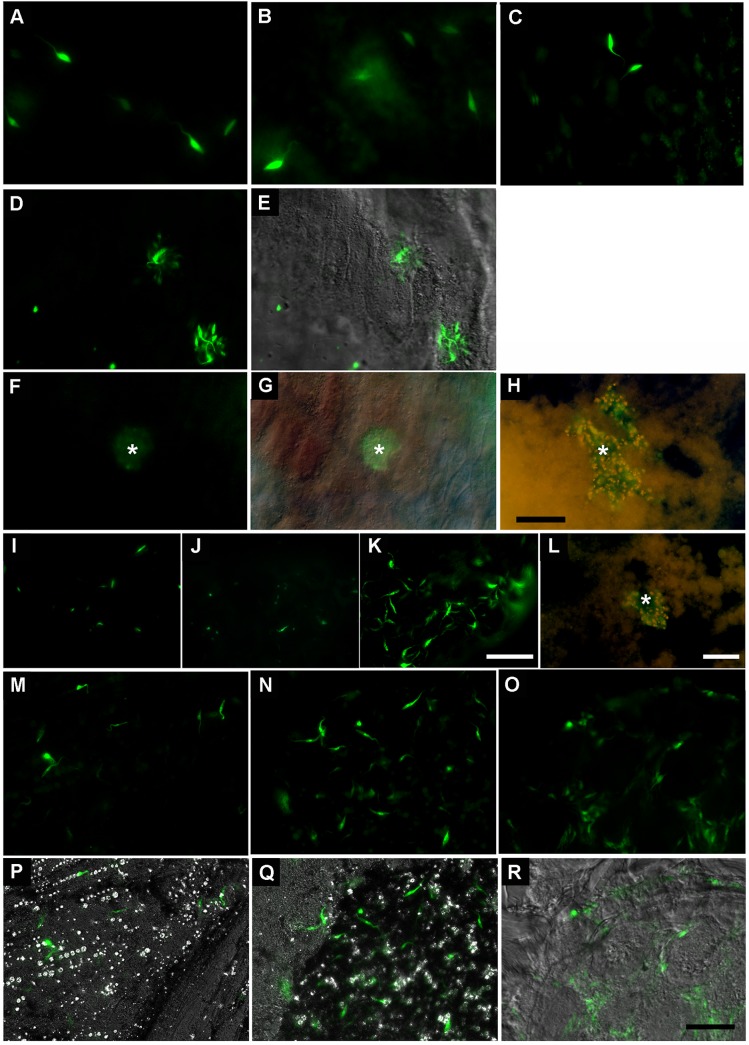
Methodology/principal findings: qPCR analysis of the parasite load in the insect gut showed several limitations due mainly to the presence of digestive-derived products that are thought to degrade DNA and inhibit further the PCR reaction. We developed a real-time PCR strategy targeting the T. cruzi repetitive satellite DNA sequence using as internal standard for normalization, an exogenous heterologous DNA spiked into insect samples extract, to precisely quantify the parasite load in each segment of the insect gut (anterior midgut, AM, posterior midgut, PM, and hindgut, H). Using combined fluorescence microscopy and BLI imaging as well as qPCR analysis, we showed that during their journey through the insect digestive tract, most of the parasites are lysed in the AM during the first 24 hours independently of the gut microbiota. During this short period, live parasites move through the PM to establish the onset of infection. At days 3-4 post-infection (p.i.), the parasite population begins to colonize the H to reach a climax at day 7 p.i., which is maintained during the next two weeks. Remarkably, the fluctuation of the parasite number in H remains relatively stable over the two weeks after refeeding, while the populations residing in the AM and PM increases slightly and probably constitutes the reservoirs of dividing epimastigotes.

Conclusions/significance: These data show that a tuned dynamic control of the population operates in the insect gut to maintain an equilibrium between non-dividing infective trypomastigote forms and dividing epimastigote forms of the parasite, which is crucial for vector competence.


Conflict of interest statement

The authors have declared that no competing interests exist.

Figures

Fig 1
Fig 1. Representative standard qPCR calibration curves generated from 10-fold serial DNA dilutions of blood spiked with T. cruzi Dm28c (A) or CL Brener (B).
The results are expressed as parasite equivalents/50 ng DNA. The slope and regression coefficient of the curves as well as the amplification efficiency for each parasite lineage are indicated.
Fig 2
Fig 2. Real-time monitoring of T. cruzi loads in the different gut segments after R. prolixus infection.
(A) Follow-up of parasite development in the anterior midgut (AM), posterior midgut (PM) and hindgut (H) post-infection (p.i.) and post-feeding (p.f.). Adult insects were fed with 107 cells/ml of blood. The arrowhead and arrow indicates, respectively, the time of the initial infection and refeeding with a blood meal without parasites (21 days p.i.). Each time point represents three independent experiments (n≥8). The percentage of metacyclic trypomastigote forms (mean ± SE; n = 10) determined in the hindgut contents at 7 and 14 days p.i. and 14 days p.f. are indicated. (B) Monitoring of the DNA clearance of heat-killed parasites. Infections were performed with live parasites or parasites killed by incubation at 65°C during 2 hours before injection. n≥4 for each time point. (C) Comparison between the gut colonization of R. prolixus by T. cruzi Dm28c (left panel) and CL Brener (right panel). Each time point represents three independent experiments (n≥8). At several time points, the insects were dissected, and total DNA was extracted individually from the different gut segments and used to assess the parasite number by qPCR.
Fig 3
Fig 3. Real-time in vivo BLI of Trypanosoma cruzi infection in R. prolixus.
(A) Insects were infected with T. cruzi Dm28c epimastigotes constitutively expressing luciferase, and time-course monitoring of infection was assessed for two weeks by BLI. (B) Quantification of the luminescence signal emitted by the infected insects at the times indicated in A. (C) In vivo luminescence evaluation of insects at day 3 and 7 p.i. and ex vivo at day 7. (D) Correlation between the bioluminescence emission measured in each well and parasite number. The images are representative of at least 24 insects analyzed at each time point in three independent experiments. The images of all of the insects analyzed at each time point were used to quantify the mean of the emitted luminescence signal.
Fig 4
Fig 4. BLI of infected insects after feeding.
In vivo (A, B) and ex vivo (C) BLI showing that at one to two weeks after refeeding, most of the parasites remains densely packed in the rectum, as evidenced by the punctuated luminescent signal located at the end of the digestive tract.
Fig 5
Fig 5. BLI time-course development of T. cruzi expressing luciferase in the insect digestive tract during the first 24 h p.i.
(A) The images show the drastic reduction of the luminescence signal in the AM. (B) Quantification of the BLI signal emitted by the whole intestine obtained at different times as indicated in A. (C) Ex vivo BLI confirming that the signal was located exclusively in PM 24 hours p.i.. (D) Quantification of the BLI signal emitted by AM (a) and PM (b) at 0 and 24 hours after infection. (E) Effect of the microbiota on parasite lysis and BLI reduction. The insects were infected with parasites alone (Tc) or with parasites plus 2.5 x 10⁷ or 2.5 x 10⁸ Rhodococcus rhodnii per ml of blood. Two independent experiments (n = 16) were conducted, and the results were analyzed by one-way ANOVA.
Fig 6
Fig 6. Comparison of time-course development of epimastigotes and trypomastigotes expressing luciferase in the digestive tract of R. prolixus during the first 24 h p.i., in the presence or absence of R. rhodnii.
(A) Representative values of the luminescence emission for epimastigotes and trypomastigotes at 6 h and 24 h. Epi 6 h vs. Epi 24 h, P<0.01; Trypo 6 h vs. Trypo 24 h, P<0.0001. ANOVA followed by Tukey's multiple comparisons test. (B) Quantification of the BLI signal emitted by adult insects infected with various amounts of epimastigotes (Epi) or trypomastigotes (Trypo). (C) Quantification of the BLI signal emitted by gut microbiota-free first instar nymphs fed with epimastigote (Epi) or trypomastigote (Trypo) forms (107 cells/ml), in the presence or absence of R. rhodnii. In each stage ± bacteria, 6 h vs. 24 h, P<0.001. ANOVA followed by Tukey's multiple comparisons test.
Fig 7
Fig 7. Fluorescence microscopy of digestive tracts extracted from insects infected with GFP-tagged parasites.
The images show the presence of green fluorescent parasites colonizing the AM (A-H), PM (I-L) and H (M-R). (A-C) Fluorescence images of the AM showing free-swimming parasites at days 1, 2 and 7 p.i., respectively. (D-H) Fluorescence and DIC images showing parasite aggregates, at day 1 p.i. (D, E), and day 4 p.i. (F-H). The asterisks indicate aggregate of parasites associated to gut wall. (I-K) Fluorescence images of the PM at days 1, 2 and 7 p.i.. (L) Fluorescence image at day 4 p.i.. The asterisk indicates a cluster of parasites in the lumen of the PM. Fluorescence and DIC images of the H at days 4 (M, P), 7 (N, Q) and 21 (O, R) p.i., respectively. Scale bars: (A-H) 50 μm; (I-K) 50 μm; (L) 10 μm; (M-R) 50 μm. A-E, I-K, M-Q and F-H and L images were performed, respectively, using a Zeiss Axioplan 2 fluorescence microscope and a Zeiss Axioplan 2 fluorescence microscope.
Fig 8
Fig 8. Real-time monitoring of R. prolixus gut colonization by T. cruzi in natural conditions.
Follow-up of parasite development in the anterior midgut (AM), posterior midgut (PM) and hindgut (H) post-infection (p.i.) and post-feeding (p.f.) in epimastigotes (A) and metacyclics trypomastigotes (B). Adult insects were fed with 107 cells/ml. The arrowhead and arrow indicates, respectively, the time of the initial infection a trypomastigotes and refeeding (21 days p.i.). At several time points, the insects were dissected, and total DNA was extracted individually from the different gut segments and used to assess the parasite number by qPCR. Each time point represents an experiment (n = 8).

References

    1. Maguire JH (2006) Chagas' disease—can we stop the deaths? N Engl J Med 355: 760–761. - PubMed
    1. Teixeira AR, Nascimento RJ, Sturm NR (2006) Evolution and pathology in chagas disease—a review. Mem Inst Oswaldo Cruz 101: 463–491. - PubMed
    1. Hotez PJ, Dumonteil E, Betancourt Cravioto M, Bottazzi ME, Tapia-Conyer R, et al. (2013) An unfolding tragedy of Chagas disease in North America. PLoS Negl Trop Dis 7: e2300 10.1371/journal.pntd.0002300 - DOI - PMC - PubMed
    1. Kollien AH, Schaub GA (2000) The development of Trypanosoma cruzi in triatominae. Parasitol Today 16: 381–387. - PubMed
    1. Wigglesworth VB (1972) The principies of insect physiology 7th ed. London: Chapman & Hall. 827 p.

Publication types

LinkOut - more resources