

Self-Assembly of a Functional Oligo(Aniline)-Based Amphiphile into Helical Conductive Nanowires
- PMID: 26496508
- PMCID: PMC4694622
- DOI: 10.1021/jacs.5b06892
Self-Assembly of a Functional Oligo(Aniline)-Based Amphiphile into Helical Conductive Nanowires
Abstract
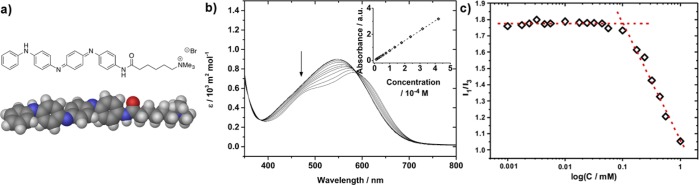
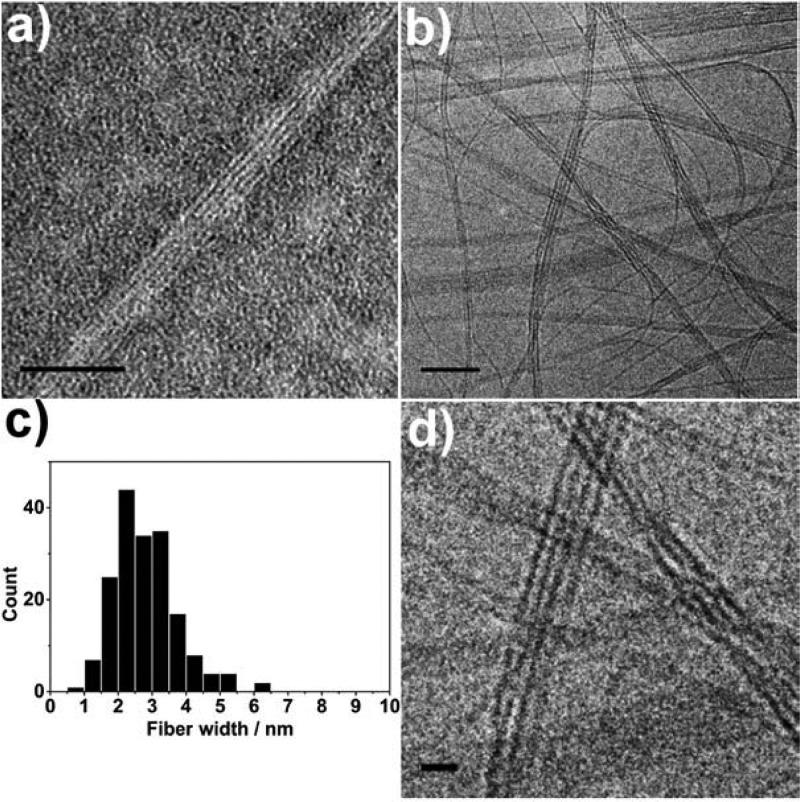
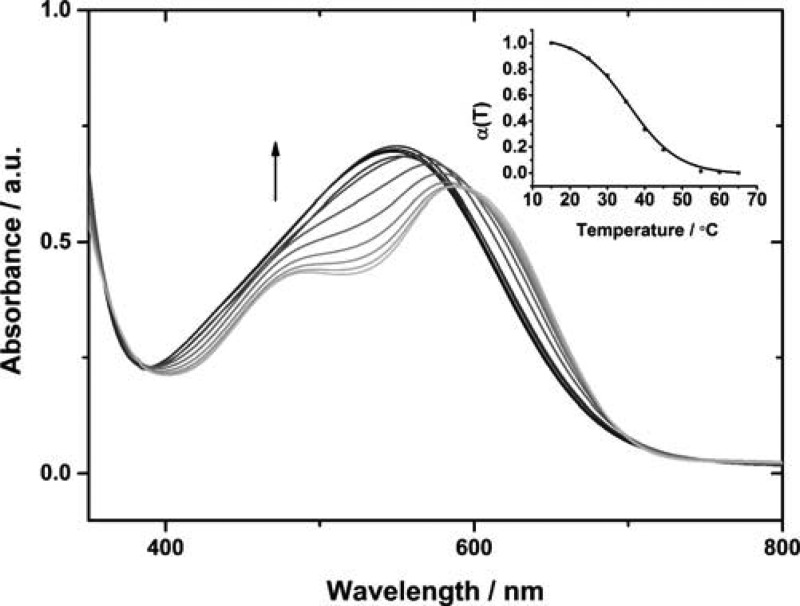
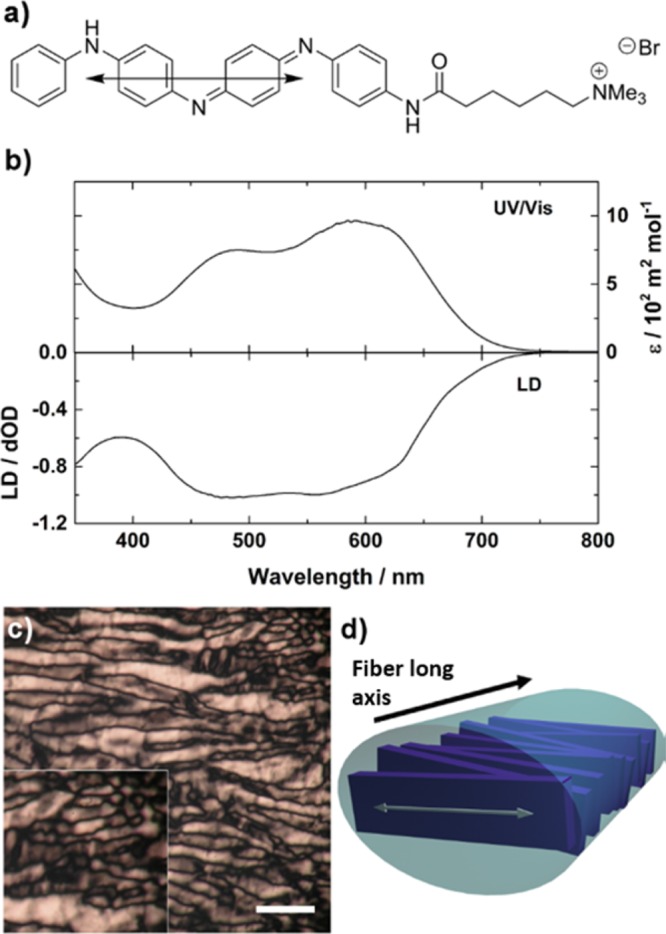
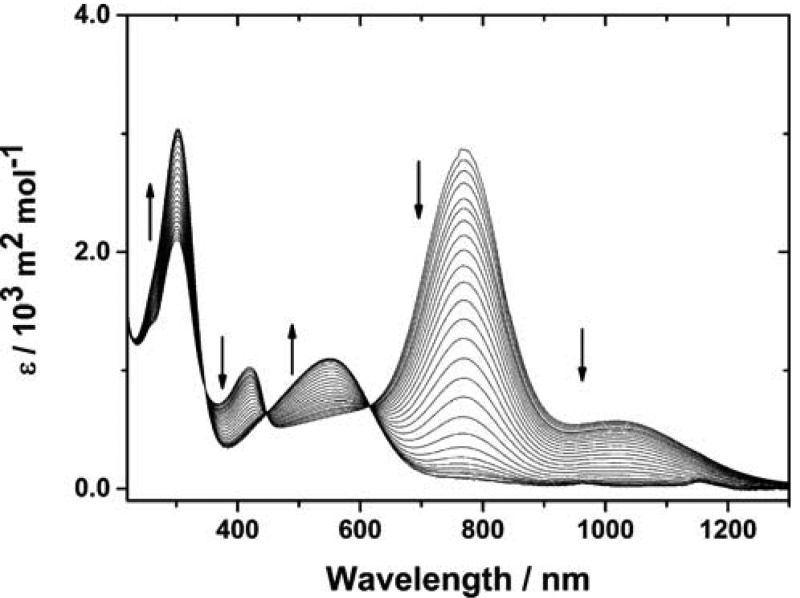
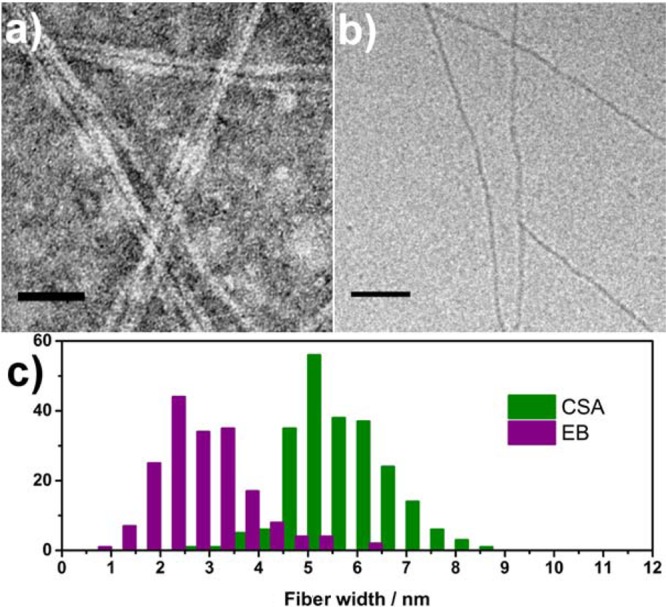
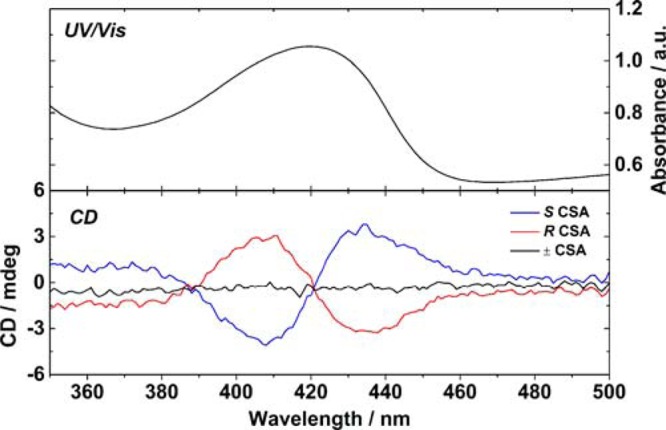
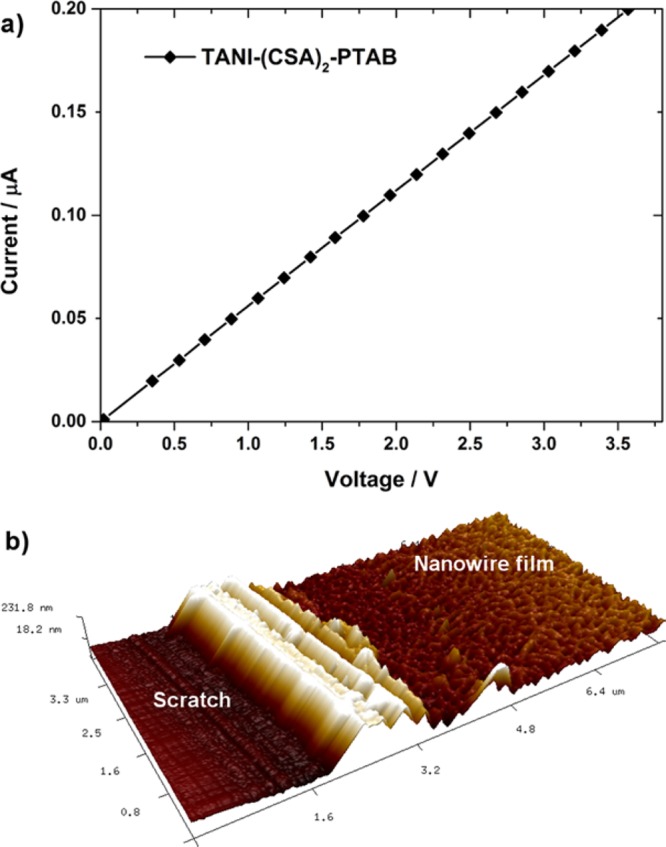
A tetra(aniline)-based cationic amphiphile, TANI-NHC(O)C5H10N(CH3)3(+)Br(-) (TANI-PTAB) was synthesized, and its emeraldine base (EB) state was found to self-assemble into nanowires in aqueous solution. The observed self-assembly is described by an isodesmic model, as shown by temperature-dependent UV-vis investigations. Linear dichroism (LD) studies, combined with computational modeling using time-dependent density functional theory (TD-DFT), suggests that TANI-PTAB molecules are ordered in an antiparallel arrangement within nanowires, with the long axis of TANI-PTAB arranged perpendicular to the nanowire long axis. Addition of either S- or R- camphorsulfonic acid (CSA) to TANI-PTAB converted TANI to the emeraldine salt (ES), which retained the ability to form nanowires. Acid doping of TANI-PTAB had a profound effect on the nanowire morphology, as the CSA counterions' chirality translated into helical twisting of the nanowires, as observed by circular dichroism (CD). Finally, the electrical conductivity of CSA-doped helical nanowire thin films processed from aqueous solution was 2.7 mS cm(-1). The conductivity, control over self-assembled 1D structure and water-solubility demonstrate these materials' promise as processable and addressable functional materials for molecular electronics, redox-controlled materials and sensing.
Figures
Similar articles
-
An addressable packing parameter approach for reversibly tuning the assembly of oligo(aniline)-based supra-amphiphiles.Chem Sci. 2018 Apr 2;9(19):4392-4401. doi: 10.1039/c8sc00068a. eCollection 2018 May 21. Chem Sci. 2018. PMID: 29896380 Free PMC article.
-
Tunable Self-Assembled Nanostructures of Electroactive PEGylated Tetra(Aniline) Based ABA Triblock Structures in Aqueous Medium.Front Chem. 2019 Jul 25;7:518. doi: 10.3389/fchem.2019.00518. eCollection 2019. Front Chem. 2019. PMID: 31403042 Free PMC article.
-
Amphiphilic Peptoid-Directed Assembly of Oligoanilines into Highly Crystalline Conducting Nanotubes.Macromol Rapid Commun. 2022 Feb;43(4):e2100639. doi: 10.1002/marc.202100639. Epub 2022 Jan 17. Macromol Rapid Commun. 2022. PMID: 35038198
-
Nanowire-based sensor electronics for chemical and biological applications.Analyst. 2021 Nov 8;146(22):6684-6725. doi: 10.1039/d1an01096d. Analyst. 2021. PMID: 34667998 Review.
-
Intrinsically Conductive Microbial Nanowires for 'Green' Electronics with Novel Functions.Trends Biotechnol. 2021 Sep;39(9):940-952. doi: 10.1016/j.tibtech.2020.12.005. Epub 2021 Jan 6. Trends Biotechnol. 2021. PMID: 33419586 Review.
Cited by
-
Aqueous Self-Assembly of Block Copolymers to Form Manganese Oxide-Based Polymeric Vesicles for Tumor Microenvironment-Activated Drug Delivery.Nanomicro Lett. 2020 Jun 11;12(1):124. doi: 10.1007/s40820-020-00447-9. Nanomicro Lett. 2020. PMID: 34138110 Free PMC article.
-
An addressable packing parameter approach for reversibly tuning the assembly of oligo(aniline)-based supra-amphiphiles.Chem Sci. 2018 Apr 2;9(19):4392-4401. doi: 10.1039/c8sc00068a. eCollection 2018 May 21. Chem Sci. 2018. PMID: 29896380 Free PMC article.
-
Self-Assembling Hydrogel Structures for Neural Tissue Repair.ACS Biomater Sci Eng. 2021 Sep 13;7(9):4136-4163. doi: 10.1021/acsbiomaterials.1c00030. Epub 2021 Mar 29. ACS Biomater Sci Eng. 2021. PMID: 33780230 Free PMC article. Review.
-
Dynamic and programmable morphology and size evolution via a living hierarchical self-assembly strategy.Nat Commun. 2018 Jul 17;9(1):2772. doi: 10.1038/s41467-018-05142-3. Nat Commun. 2018. PMID: 30018381 Free PMC article.
-
Impact of charge switching stimuli on supramolecular perylene monoimide assemblies.Chem Sci. 2019 May 14;10(22):5779-5786. doi: 10.1039/c8sc05595e. eCollection 2019 Jun 14. Chem Sci. 2019. PMID: 31293765 Free PMC article.
References
-
- Jatsch A.; Schillinger E.-K.; Schmid S.; Bäuerle P. J. Mater. Chem. 2010, 20, 3563–357810.1039/b926594e. - DOI
Publication types
LinkOut - more resources
Full Text Sources
Other Literature Sources
Research Materials
