

Performance of Apparent Diffusion Coefficient Values and Conventional MRI Features in Differentiating Tumefactive Demyelinating Lesions From Primary Brain Neoplasms
- PMID: 26496556
- PMCID: PMC4679155
- DOI: 10.2214/AJR.14.13970
Performance of Apparent Diffusion Coefficient Values and Conventional MRI Features in Differentiating Tumefactive Demyelinating Lesions From Primary Brain Neoplasms
Abstract
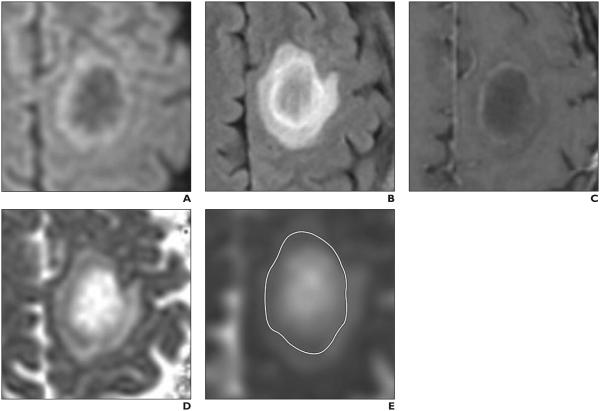
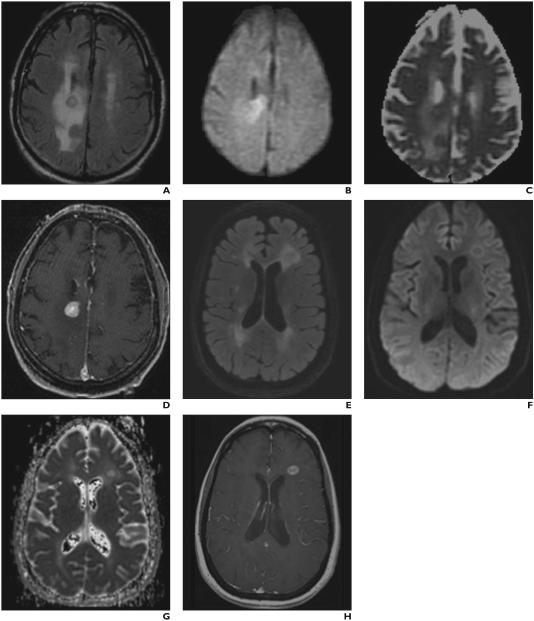
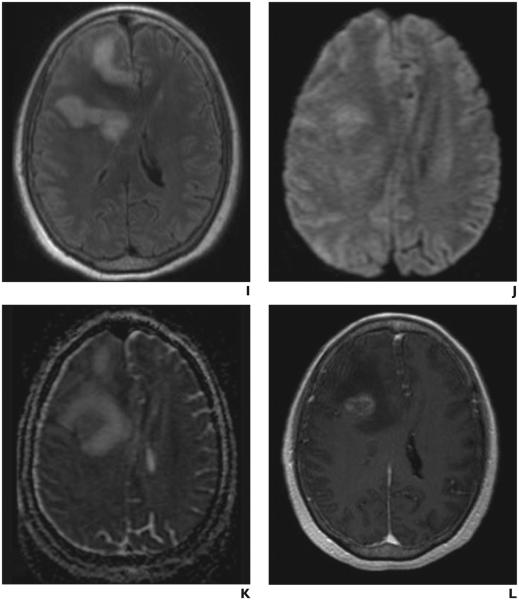
Objective: Tumefactive demyelinating lesions (TDLs) remain one of the most common brain lesions to mimic a brain tumor, particularly primary CNS lymphoma (PCNSL) and high-grade gliomas. The purpose of our study was to evaluate the ability of apparent diffusion coefficient (ADC) values and conventional MRI features to differentiate TDLs from PCNSLs and high-grade gliomas.
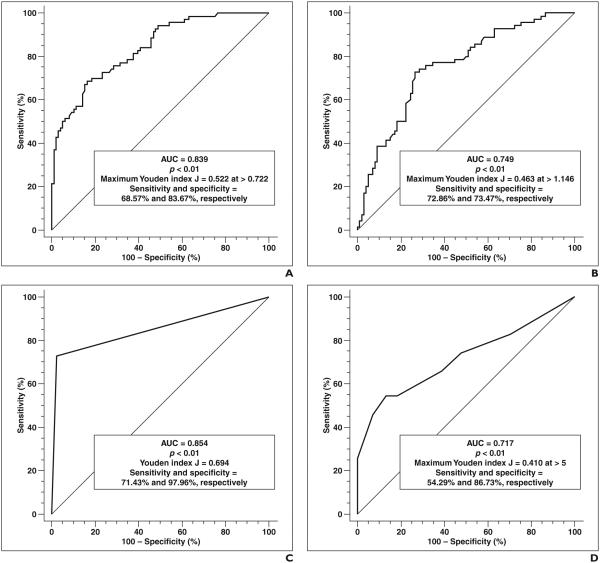
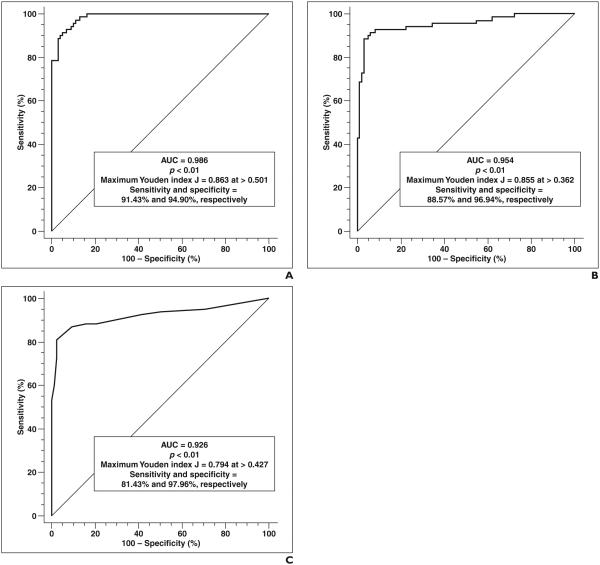
Materials and methods: Seventy-five patients (24 patients with TDLs, 28 with PCNSLs, and 23 with high-grade gliomas) with 168 brain lesions (70 TDLs, 68 PCNSLs, and 30 high-grade gliomas) who underwent DWI before surgery or therapy were included in the study. Minimum ADC (ADC(min)) and average ADC (ADC(avg)) values were calculated for each lesion. ANOVA and ROC analyses were performed. ROC analyses were also performed for the presence of incomplete rim enhancement and for the number of lesions. Multiple-variable logistic regression with ROC analysis was then performed to evaluate performance in multiple-variable models.
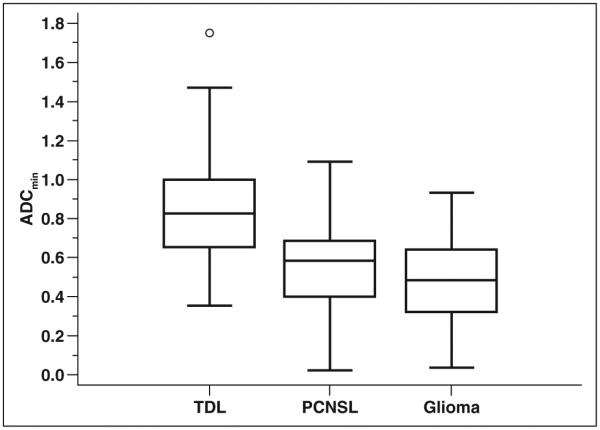
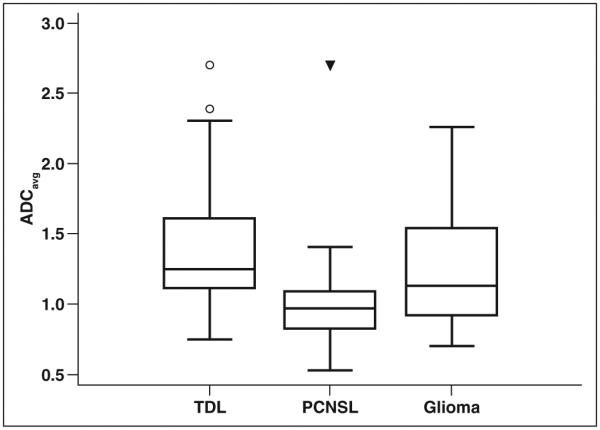
Results: ADC(min) was statistically significantly higher (p < 0.01) in TDLs (mean, 0.886; 95% CI, 0.802-0.931) than in PCNSLs (0.547; 95% CI, 0.496-0.598) and high-grade gliomas (0.470; 95% CI, 0.385-0.555). (All ADC values in this article are reported in units of × 10(-3) mm(2)/s.) ADC(avg) was statistically significantly higher (p < 0.01) in TDLs (mean, 1.362; 95% CI, 1.268-1.456) than in PCNSLs (0.990; 95% CI, 0.919-1.061) but not in high-grade gliomas (1.216; 95% CI, 1.074-1.356). Multiple-variable models showed statistically significant individual effects and superior diagnostic performance on ROC analysis.
Conclusion: TDLs can be diagnosed on preoperative MRI with a high degree of specificity; MRI features of incomplete rim enhancement, high ADC values, and a large number of lesions individually increase the probability and diagnostic confidence that a lesion is a TDL.
Keywords: apparent diffusion coefficient (ADC); diffusion; primary CNS lymphoma (PCNSL); tumefactive demyelinating lesion (TDL); tumefactive demyelination.
Figures
Similar articles
-
Histogram analysis of apparent diffusion coefficient maps for differentiating primary CNS lymphomas from tumefactive demyelinating lesions.AJR Am J Roentgenol. 2015 Apr;204(4):827-34. doi: 10.2214/AJR.14.12677. AJR Am J Roentgenol. 2015. PMID: 25794073
-
Measurements of diagnostic examination performance using quantitative apparent diffusion coefficient and proton MR spectroscopic imaging in the preoperative evaluation of tumor grade in cerebral gliomas.Eur J Radiol. 2011 Nov;80(2):462-70. doi: 10.1016/j.ejrad.2010.07.017. Epub 2010 Aug 13. Eur J Radiol. 2011. PMID: 20708868
-
Distinguishing tumefactive demyelinating lesions from glioma or central nervous system lymphoma: added value of unenhanced CT compared with conventional contrast-enhanced MR imaging.Radiology. 2009 May;251(2):467-75. doi: 10.1148/radiol.2512072071. Epub 2009 Mar 4. Radiology. 2009. PMID: 19261924
-
MRI Findings in Tumefactive Demyelinating Lesions: A Systematic Review and Meta-Analysis.AJNR Am J Neuroradiol. 2018 Sep;39(9):1643-1649. doi: 10.3174/ajnr.A5775. Epub 2018 Aug 16. AJNR Am J Neuroradiol. 2018. PMID: 30115676 Free PMC article.
-
Tumefactive demyelinating lesions: A comprehensive review.Mult Scler Relat Disord. 2017 May;14:72-79. doi: 10.1016/j.msard.2017.04.003. Epub 2017 Apr 9. Mult Scler Relat Disord. 2017. PMID: 28619436 Review.
Cited by
-
Establishment of an MRI-based radiomics model for distinguishing between intramedullary spinal cord tumor and tumefactive demyelinating lesion.BMC Med Imaging. 2024 Nov 21;24(1):317. doi: 10.1186/s12880-024-01499-8. BMC Med Imaging. 2024. PMID: 39574000 Free PMC article.
-
Necrotic Primary Central Nervous System Lymphoma in an Immunocompetent Patient: A Case Report and Literature Review.Cureus. 2019 Jun 17;11(6):e4910. doi: 10.7759/cureus.4910. Cureus. 2019. PMID: 31423387 Free PMC article.
-
Primary uterine non-Hodgkin's lymphoma:a rare case report and review of the literature.Front Oncol. 2024 Dec 18;14:1462353. doi: 10.3389/fonc.2024.1462353. eCollection 2024. Front Oncol. 2024. PMID: 39744009 Free PMC article.
-
Clinical applications of diffusion-weighted sequence in brain imaging: beyond stroke.Neuroradiology. 2022 Jan;64(1):15-30. doi: 10.1007/s00234-021-02819-3. Epub 2021 Oct 1. Neuroradiology. 2022. PMID: 34596716 Free PMC article. Review.
-
Pattern Recognition of the Multiple Sclerosis Syndrome.Brain Sci. 2017 Oct 24;7(10):138. doi: 10.3390/brainsci7100138. Brain Sci. 2017. PMID: 29064441 Free PMC article. Review.
References
-
- Dagher AP, Smirniotopoulos J. Tumefactive demyelinating lesions. Neuroradiology. 1996;38:560–565. - PubMed
-
- van der Velden M, Bots GT, Endtz LJ. Cranial CT in multiple sclerosis showing a mass effect. Surg Neurol. 1979;12:307–310. - PubMed
-
- Rieth KG, Di Chiro G, Cromwell LD, et al. Primary demyelinating disease simulating glioma of the corpus callosum: report of three cases. J Neurosurg. 1981;55:620–624. - PubMed
