. 2015 Oct 22;163(3):571-82.
doi: 10.1016/j.cell.2015.10.009. Epub 2015 Oct 22.

Early divergent strains of Yersinia pestis in Eurasia 5,000 years ago

Affiliations

Early divergent strains of Yersinia pestis in Eurasia 5,000 years ago

Simon Rasmussen et al. Cell. .

Abstract

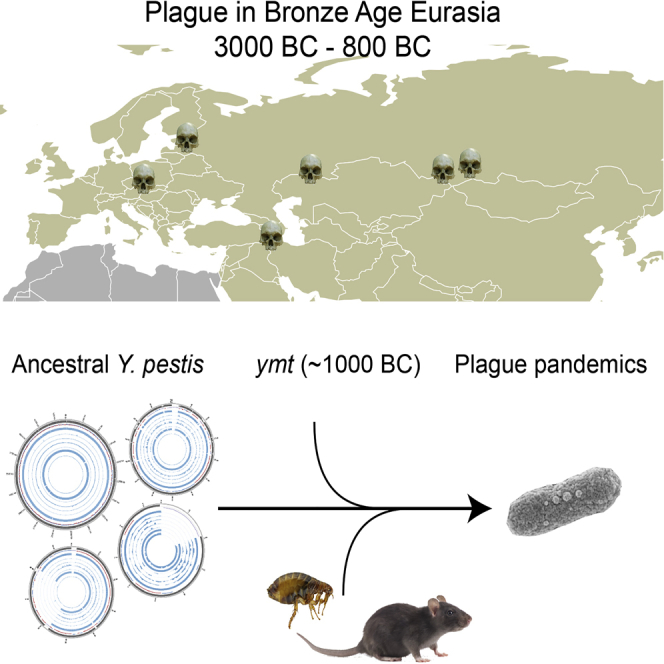
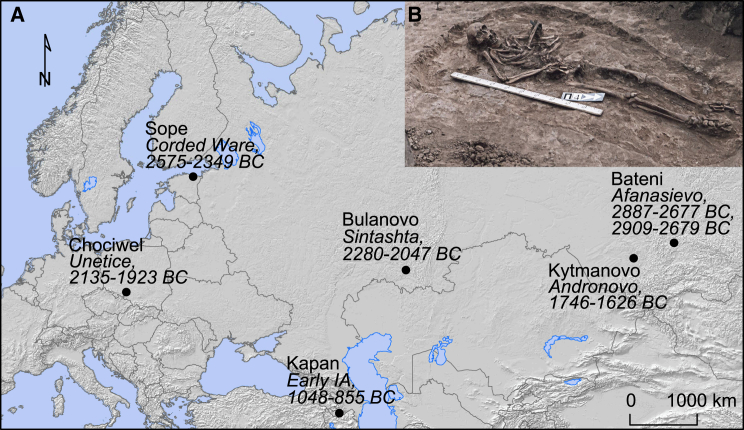
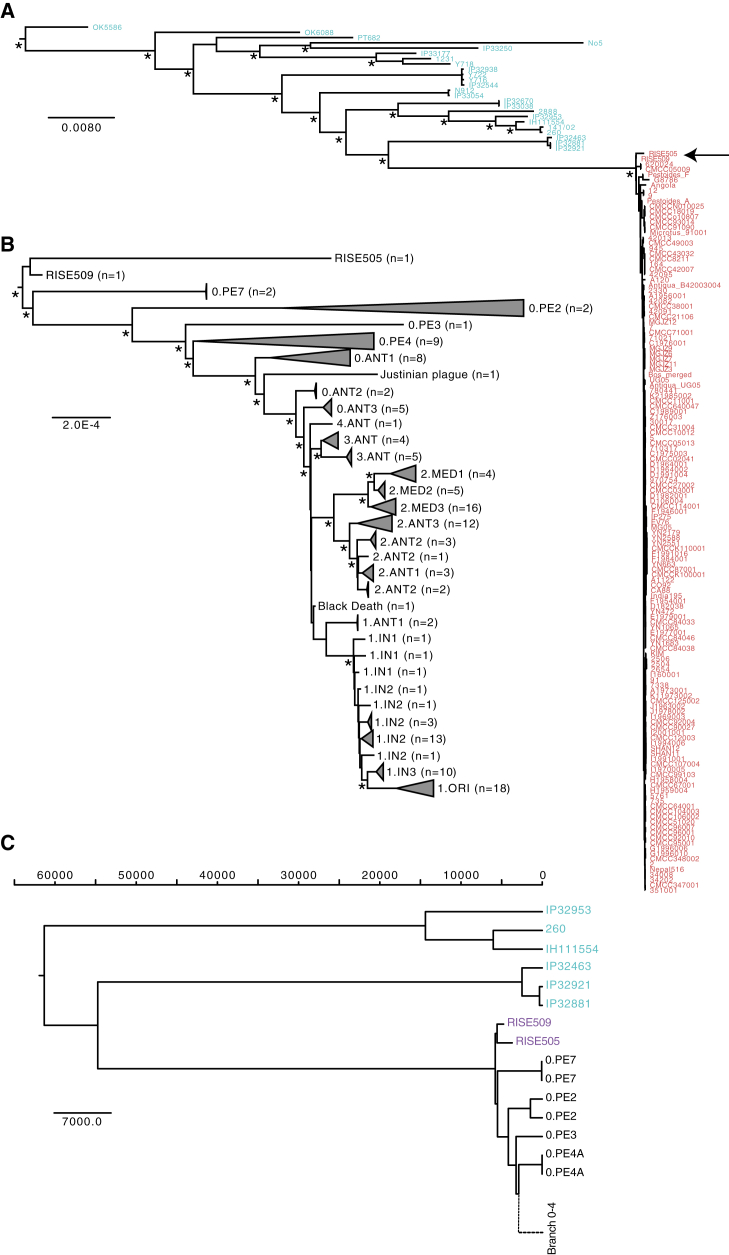
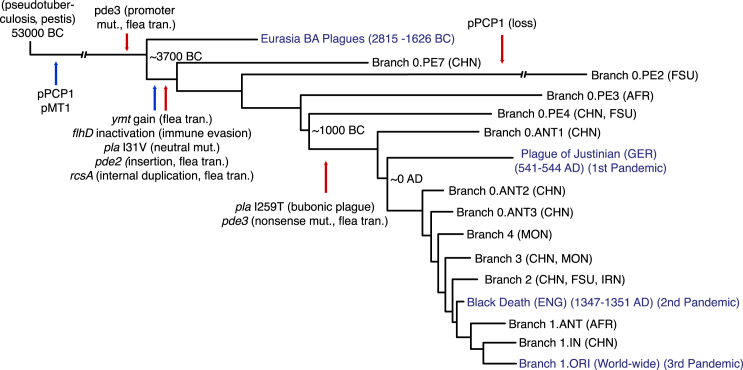
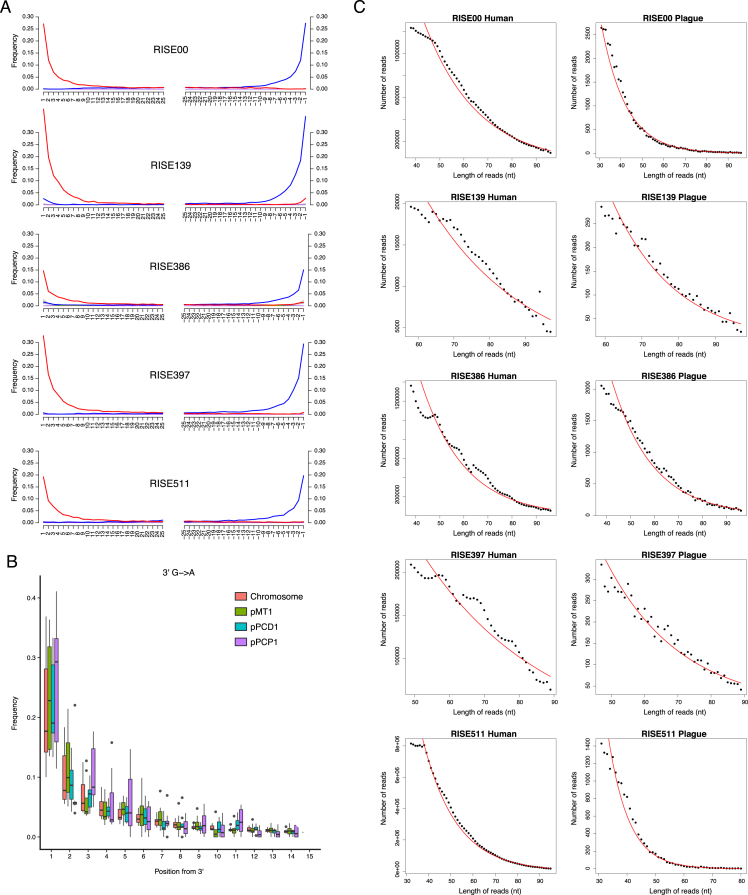
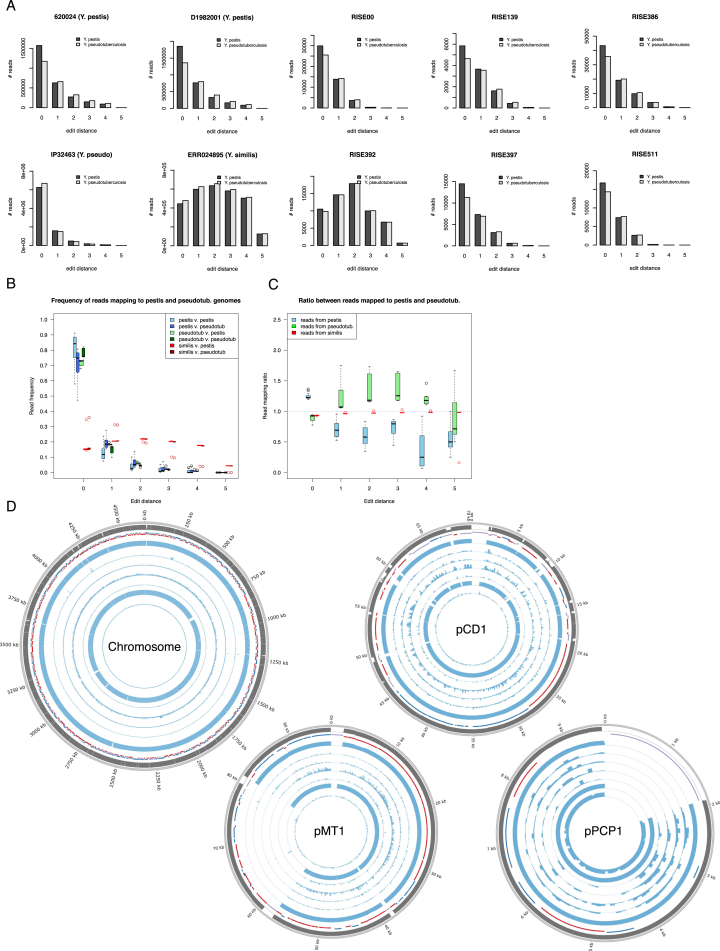
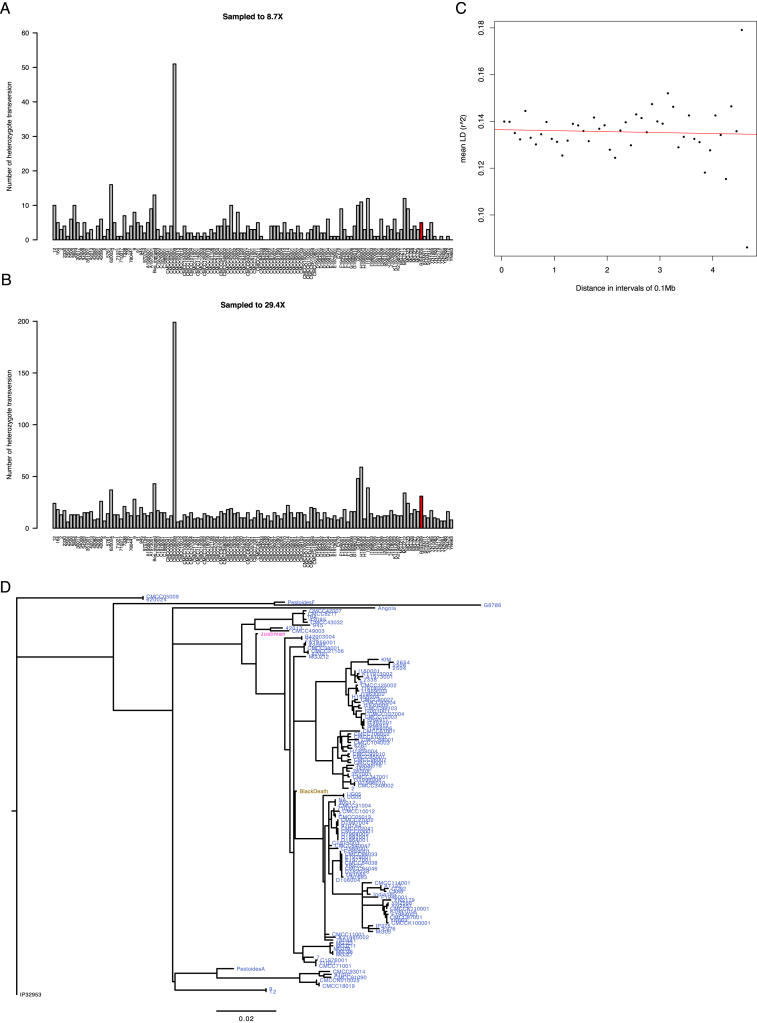
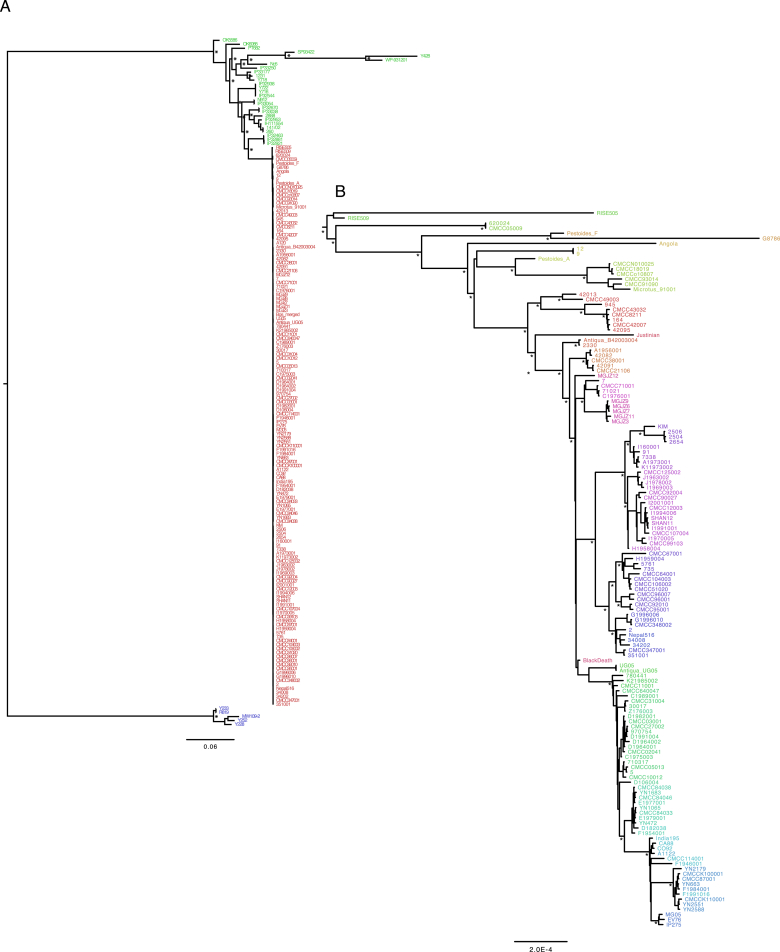
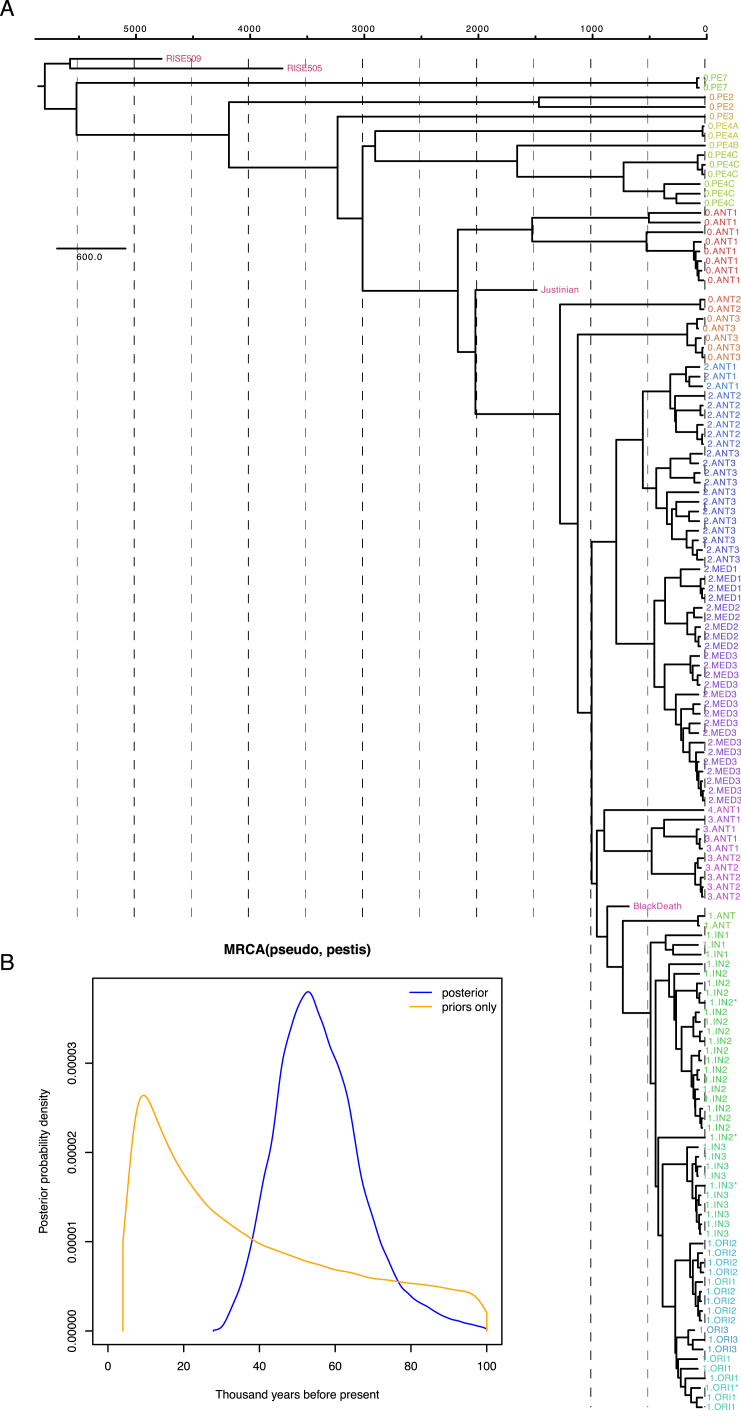
The bacteria Yersinia pestis is the etiological agent of plague and has caused human pandemics with millions of deaths in historic times. How and when it originated remains contentious. Here, we report the oldest direct evidence of Yersinia pestis identified by ancient DNA in human teeth from Asia and Europe dating from 2,800 to 5,000 years ago. By sequencing the genomes, we find that these ancient plague strains are basal to all known Yersinia pestis. We find the origins of the Yersinia pestis lineage to be at least two times older than previous estimates. We also identify a temporal sequence of genetic changes that lead to increased virulence and the emergence of the bubonic plague. Our results show that plague infection was endemic in the human populations of Eurasia at least 3,000 years before any historical recordings of pandemics.


Figures

None
Graphical abstract
Figure 1
Figure 1
Archaeological Sites of Bronze Age Yersinia pestis (A) Map of Eurasia indicating the position, radiocarbon dated ages and associated cultures of the samples in which Y. pestis were identified. Dates are given as 95% confidence interval calendar BC years. IA: Iron Age. (B) Burial four from Bulanovo site. Picture by Mikhail V. Khalyapin. See also Table S1.
Figure 2
Figure 2
Y. pestis Depth of Coverage Plots (A–D) Depth of coverage plots for (A) CO92 chromosome, (B) pCD1, (C) pMT1, (D) pPCP1. Outer ring: Mappability (gray), genes (RNA: black, transposon: purple, positive strand: blue, negative strand: red), RISE505 (blue), RISE509 (blue), Justinian plague (orange), Black Death plague (purple), modern Y. pestis D1982001 (green), Y. pseudotuberculosis IP32881 (red) sample. The modern Y. pestis and Y. pseudotuberculosis samples are included for reference. The histograms show sequence depth in 1 kb windows for the chromosome and 100 bp windows for the plasmids with a max of 20X depth for each ring. Arrow 1: ymt gene, arrow 2: transposon at start of missing region on pMT1, arrow 3: transposon at end of missing region on pMT1, arrow 4: pla gene, arrow 5: missing flagellin region on chromosome. The plots were generated using Circos (Krzywinski et al., 2009). See also Tables S2, S3 and S8.
Figure 3
Figure 3
Authenticity of Y. pestis DNA (A) DNA damage patterns for RISE505 and RISE509. The frequencies of all possible mismatches observed between the Y. pestis CO92 chromosome and the reads are reported in gray as a function of distance from 5′ (left panel, first 25 nucleotides sequenced) and distance to 3′ (right panel, last 25 nucleotides). The typical DNA damage mutations C>T (5′) and G>A (3′) are reported in red and blue, respectively. (B) Ancient DNA damage patterns (n = 7) of the reads aligned to the CO92 chromosome and the Y. pestis associated plasmids pMT1, pCD1 and pPCP1. The boxplots show the distribution of C-T damage in the 5′ of the reads. The lower and upper hinges of the boxes correspond to the 25th and 75th percentiles, the whiskers represent the 1.5 inter-quartile range (IQR) extending from the hinges, and the dots represent outliers from these. (C) DNA fragment length distributions from RISE505 and RISE509 samples representing both the Y. pestis DNA and the DNA of the human host. The declining part of the distributions is fitted to an exponential model (red). (D) Linear correlation (red) between the decay constant in the DNA of the human host and the associated Y. pestis DNA extracted from the same individual (R2 = 0.55, p = 0.055). The decay constant (λ) describes the damage fraction (i.e., the fraction of broken bonds on the DNA strand). (E) Distribution of edit distance of high quality reads from RISE505 and RISE509 samples mapped to either Y. pestis (dark gray) or Y. pseudotuberculosis (light gray) reference genomes. The reads have a higher affinity to Y. pestis than to Y. pseudotuberculosis. (F) Plots of actual coverage versus expected coverage for the 101 screened samples. Expected coverage was computed taking into account read length distributions, mappable fractions of reference sequences, and the deletions in pMT1 for some of the samples. Samples assumed to contain Y. pestis are shown in blue and RISE392 that is classified as not Y. pestis appears is shown in red. See also Figure S1 and S2, Table S3.
Figure 4
Figure 4
Phylogenetic Reconstructions (A) Maximum Likelihood reconstruction of the phylogeny of Y. pseudotuberculosis (blue) and Y. pestis (red). The tree is rooted using Y. similis (not shown). The full tree including three additional Y. pseudotuberculosis strains (O:15 serovar) can be seen in Figure S4. Major branching nodes within Y. pseudotuberculosis with > 95% bootstrap support are indicated with an asterisk and branch lengths are given as substitutions per site. (B) Maximum Likelihood reconstruction of the phylogeny in (A) showing only the Y. pestis clade. The clades are collapsed by population according to branches and serovars, as given in (Achtman et al., 1999, Achtman et al., 2004, Cui et al., 2013). See Figure S4 for an uncollapsed tree and Table S2 for details on populations. Nodes with more than 95% bootstrap support are indicated with an asterisk and branch lengths are given as substitutions per site. (C) BEAST2 maximum clade credibility tree showing median divergence dates. Branch lengths are given as years before the present (see Divergence estimations in Experimental Procedures). Only the Y. pseudotuberculosis (blue), the ancient Y. pestis samples (magenta) and the most basal branch 0 strains (black) are shown. For a full tree including all Y. pestis see Figure S5. See also Figure S3, S4, and S5 and Table S5.
Figure 5
Figure 5
Identification of Virulence Genes (A) Gene coverage heatmap of 55 virulence genes (rows) in 140 Y. pestis strains (columns). Sample ordering is based on hierarchical clustering (not shown) of the gene coverage distributions. RISE505 and RISE509 are marked with a red asterisk. Coloring goes from 0% gene coverage (white) to 100% gene coverage (blue). (B) Depth of coverage of high quality reads mapping across pMT1. Outer ring is mappability (gray), genes (RNA: black, transposon: purple, positive strand: blue, negative strand: red) and then the RISE samples ordered after direct AMS dating. Sample ordering are RISE509, RISE511, RISE00, RISE386, RISE139, RISE505 and RISE397. See also Figure S6, Tables S2, S6, and S7. AMS: Accelerator Mass Spectrometry.
Figure 6
Figure 6
Schematic of Y. pestis Evolution Representation of Y. pestis phylogeny and important evolutionary events since divergence from Y. pseudotuberculosis. Genetic gains (blue) and genetic loss or loss of function mutations (red) are indicated by arrows. Historical recorded pandemics are indicated in blue text. The calendric years indicates the primary outbreak of the Pandemic. Node dates are median divergence times from the BEAST analysis. The events are based on information from this study and Sun et al., 2014. We used the VCFs generated from all Y. pestis samples (n = 142) (Table S2) to verify on which branches the genetic events occurred. The figure is based on current knowledge and is subject to change with addition of new samples. See also Figure S5 and Table S5. BA: Bronze Age, CHN: China, FSU: Former Soviet Union, AFR: Africa, GER: Germany, MON: Mongolia, IRN: Iran, ENG: England, flea tran: flea transmission, mut.: mutation.
Figure S1
Figure S1
DNA Damage and Decay, Related to Figure 3 (A) DNA damage patterns for the five Y. pestis associated samples not shown in Figure 3. The frequencies of all possible mismatches observed between the Y. pestis CO92 chromosome and the reads are reported in gray as a function of distance from 5′ (left panel, first 25 nucleotides sequenced) and distance to 3′ (right panel, last 25 nucleotides). The typical DNA damage bases are C>T (5′) and G>A (3′) mutations are reported in red and blue, respectively. (B) Ancient DNA damage patterns of the reads aligned to the CO92 chromosome and the Y. pestis associated plasmids pMT1, pCD1 and pPCP1. The boxplots show the distribution of G-A damage in the 3′ of the reads. The distributions are made from the seven Y. pestis samples. The lower and upper hinges of the boxes correspond to the 25th and 75th percentiles, the whiskers represent the 1.5 inter-quartile range (IQR) extending from the hinges, and the dots represent outliers from these. (C) DNA fragment length distributions from five Y. pestis samples not shown in Figure 3 representing both the Y. pestis DNA and the DNA of the human host. The declining part of the distributions is fitted to an exponential model (red).
Figure S2
Figure S2
Mapping Affinity, Related to Figure 3 (A) Distribution of edit distance of high quality reads of known origin and the eight Yersinia associated samples. The investigated, known reads are from Y. pestis 620024 (0.PE7), Y. pestis D1982001 (1.IN2), Y. pseudo (IP32464) (from the clade closest to Y. pestis), and Y. similis (which is an outgroup to both Y. pestis and Y. pseudotuberculosis). For RISE00, RISE139, RISE386, RISE397, RISE505, RISE509 and RISE511 the reads are closer to Y. pestis than to Y. pseudotuberculosis, and there are far more hits at low edit distances (RISE505 and RISE509 are shown in Figure 3). This is consistent with these reads originating from Y. pestis. Reads from the RISE392 sample instead have more hits at higher edit distances and have similar distances to both the Y. pestis and Y. pseudotuberculosis reference genomes. This suggests that RISE392 is neither Y. pestis nor Y. pseudotuberculosis, but a more distantly related species. (B) Distribution of the amount of reads mapping to the Y. pestis reference genome, at different edit distances. For each of the three investigated species (Y. pestis n = 10, Y. pseudotuberculosis n = 10, and Y. similis n = 5) several different sets of reads were mapped against the reference, and the number of reads matching at different edit distances was counted. For each edit distance the distribution of reads for each species is shown in the form of a boxplot. The lower and upper hinges of the boxes correspond to the 25th and 75th percentiles, the whiskers represent the 1.5 inter-quartile range (IQR) extending from the hinges, and the dots represent outliers from these. (C) Ratio between the number of reads mapping to Y. pestis and the number of reads mapping to Y. pseudotuberculosis, for different edit distances, for three investigated species. Input data as in B. For each sample the ratio between the number of reads matching Y. pestis, and the number of reads matching Y. pseudotuberculosis was calculated, and the distribution of these ratios then shown in the form of a boxplot for each edit distance. These features were used to predict the taxonomy of unknown samples. The lower and upper hinges of the boxes correspond to the 25th and 75th percentiles, the whiskers represent the 1.5 inter-quartile range (IQR) extending from the hinges, and the dots represent outliers from these. (D) Depth of coverage plots for the seven ancient Y. pestis samples mapped to the CO92 chromosome, pCD1, pMT1 and pPCP1. The RISE samples are ordered according to age where the oldest sample is the outermost histogram. Outer ring: Mappability (gray), genes (RNA: black, transposon: purple, positive strand: blue, negative strand: red), RISE509, RISE511, RISE00, RISE386, RISE139, RISE505 and RISE397 (blue). Depth histograms show sequence depth in 1 kb windows for the chromosome and 100 bp for the plasmids with a max of 5X depth for each ring. The plots were generated using Circos.
Figure S3
Figure S3
Phylogenetics, Related to Figure 4 (A and B) Heterozygosity estimates of RISE505 (A) and RISE509 (B), the respective ancient Y. pestis samples are shown in red. All samples were downsampled to the same depth as either RISE505 or RISE509 and the number of heterozygote transversions determined (y axis). (C) Linkage Disequilibrium (LD) determined from 141 Y. pestis strains in 0.1Mb intervals across the Y. pestis CO92 chromosome. There is no decay in LD across the genome which means that there are no recombination and the phylogenetic tree can be averaged across the individual genes. (D) Maximum Likelihood tree generated using RAxML and the 2,298 phylogenetic informative sites described by Morelli et al. (2010) and Cui et al. (2013). The strains are colored by species with Y. pseudotuberculosis IP32953 being black and Y. pestis blue. The Justinian plague sample and the Black Death samples are colored in magenta and brown, respectively. Branch lengths are substitutions per site.
Figure S4
Figure S4
Phylogenetic Trees, Related to Figure 4 (A) Maximum Likelihood phylogeny of all strains used in the analysis. Y. similis (blue), Y. pseudotuberculosis (green) and Y. pestis (red). The strains that were excluded from the phylogeny in Figure 4A: SP93422, Y428 and WP-931201. Major branch nodes with bootstrap support > 95% are indicated with an asterisk. Branch lengths are substitutions per site. (B) Maximum Likelihood tree of the Y. pestis clade only. The tree is the un-collapsed version of the tree shown in Figure 4B. Nodes marked with an asterisk have > 95% bootstrap support, not all internal nodes are marked with bootstrap values. Strain names are colored according to the population nomenclature in Table S2. Branch lengths are substitutions per site.
Figure S5
Figure S5
BEAST Divergence Dating, Related to Figures 4 and 6 (A) Maximum clade credibility tree of the Y. pestis clade. Strains are annotated based on their population (see Table S2) and colored according to population. Branch lengths are given as years before present. Taxa with asterisks in their name have not previously been assigned a population, but are named according to the clade they are placed in. (B) Posterior probability density distribution for the chain where we sampled from the priors only (orange) and the chains including the alignment data (blue).
Figure S6
Figure S6
Investigation of Virulence Genes, Related to Figure 5 (A) Depth of coverage for the seven ancient Y. pestis samples in 100 bp bins across Y. pestis Microtus 91001 genome at 1,041 kb to 1,063 kb. For each sample the upper panel represents the depth of high quality reads in the 100 bp window. The lower panel represent mappability of the particular region calculated using GEM-mappability with a k-mer of 50. (B) Multiple alignment of the rcsA gene in Y. pseudotuberculosis IP32953, Y. pestis CO92 and the contig matching the region from the RISE509 de novo assembly. The 30 bp internal duplication in CO92 is absent from the RISE509 sequence that therefore carries the ancestral IP32953 rcsA genotype.

References

    1. Achtman M., Zurth K., Morelli G., Torrea G., Guiyoule A., Carniel E. Yersinia pestis, the cause of plague, is a recently emerged clone of Yersinia pseudotuberculosis. Proc. Natl. Acad. Sci. USA. 1999;96:14043–14048. - PMC - PubMed
    1. Achtman M., Morelli G., Zhu P., Wirth T., Diehl I., Kusecek B., Vogler A.J., Wagner D.M., Allender C.J., Easterday W.R. Microevolution and history of the plague bacillus, Yersinia pestis. Proc. Natl. Acad. Sci. USA. 2004;101:17837–17842. - PMC - PubMed
    1. Allentoft M.E., Collins M., Harker D., Haile J., Oskam C.L., Hale M.L., Campos P.F., Samaniego J.A., Gilbert M.T.P., Willerslev E. The half-life of DNA in bone: measuring decay kinetics in 158 dated fossils. Proc. Biol. Sci. 2012;279:4724–4733. - PMC - PubMed
    1. Allentoft M.E., Sikora M., Sjögren K.-G., Rasmussen S., Rasmussen M., Stenderup J., Damgaard P.B., Schroeder H., Ahlström T., Vinner L. Population genomics of Bronze Age Eurasia. Nature. 2015;522:167–172. - PubMed
    1. Anthony D. Princeton University Press; Princeton: 2007. The Horse, The Wheel and Language. How Bronze-Age riders from the Eurasian Steppes Shaped the Modern World.

Publication types