

Involvement of Peripheral Nerves in the Transgenic PLP-α-Syn Model of Multiple System Atrophy: Extending the Phenotype
- PMID: 26496712
- PMCID: PMC4619736
- DOI: 10.1371/journal.pone.0136575
Involvement of Peripheral Nerves in the Transgenic PLP-α-Syn Model of Multiple System Atrophy: Extending the Phenotype
Abstract
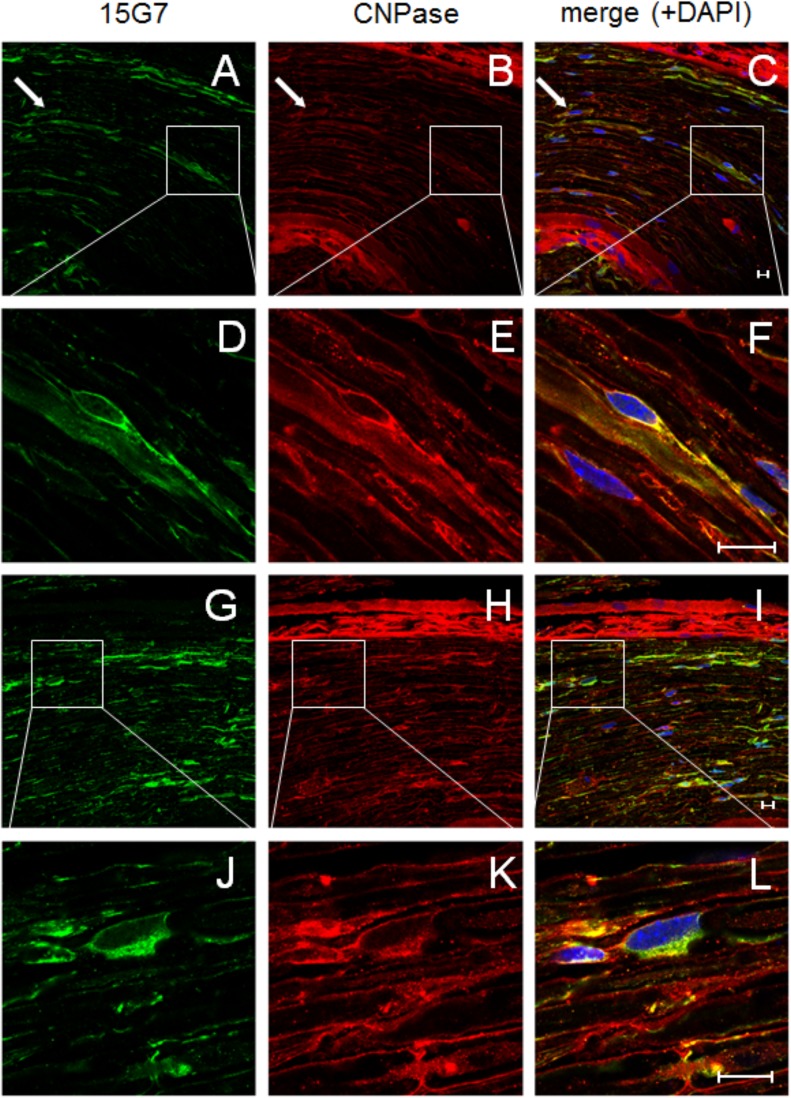
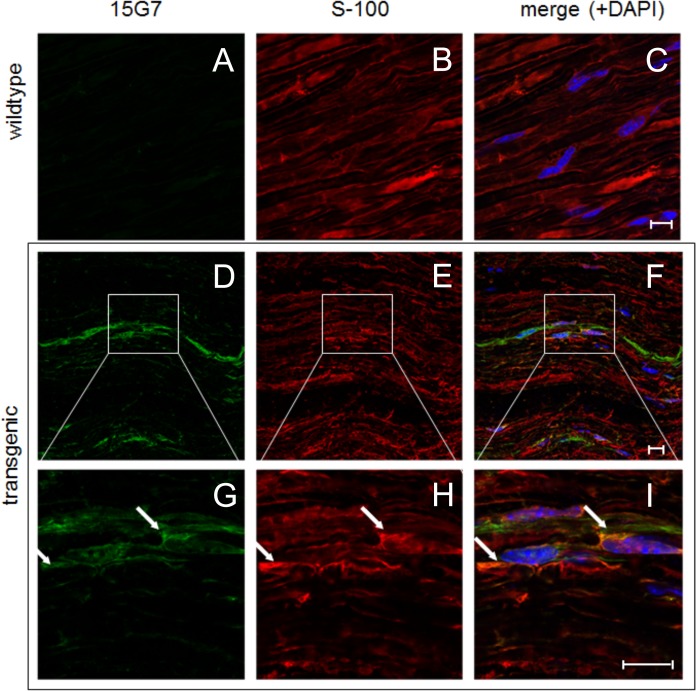
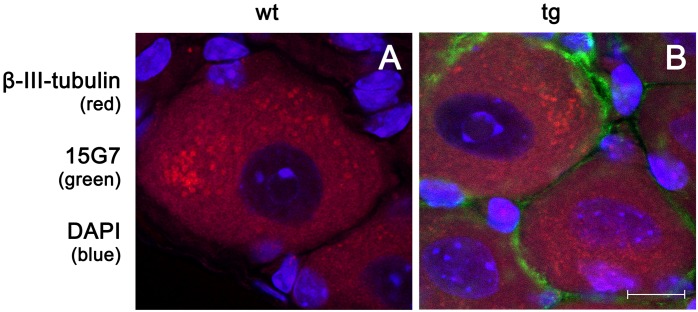
Multiple system atrophy (MSA) is a fatal, rapidly progressive neurodegenerative disease with (oligodendro-)glial cytoplasmic α-synuclein (α-syn) inclusions (GCIs). Peripheral neuropathies have been reported in up to 40% of MSA patients, the cause remaining unclear. In a transgenic MSA mouse model featuring GCI-like inclusion pathology based on PLP-promoter driven overexpression of human α-syn in oligodendroglia motor and non-motor deficits are associated with MSA-like neurodegeneration. Since α-syn is also expressed in Schwann cells we aimed to investigate whether peripheral nerves are anatomically and functionally affected in the PLP-α-syn MSA mouse model.
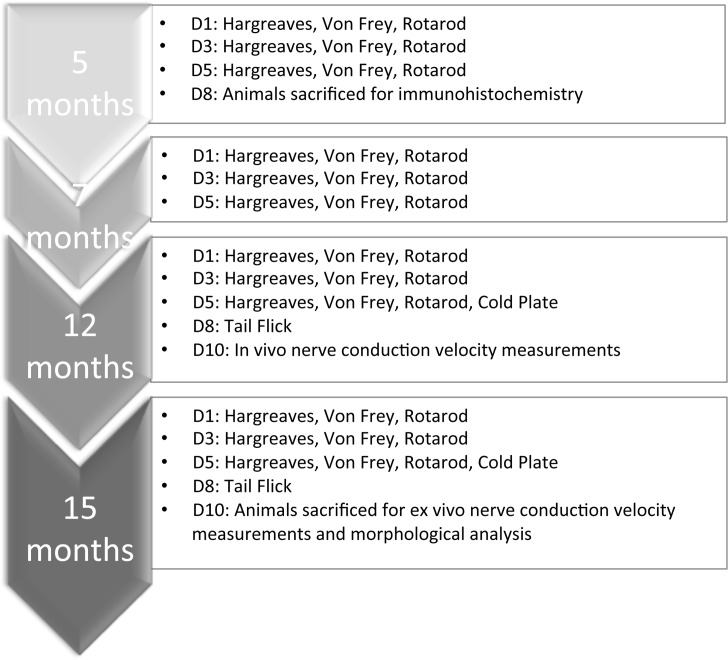
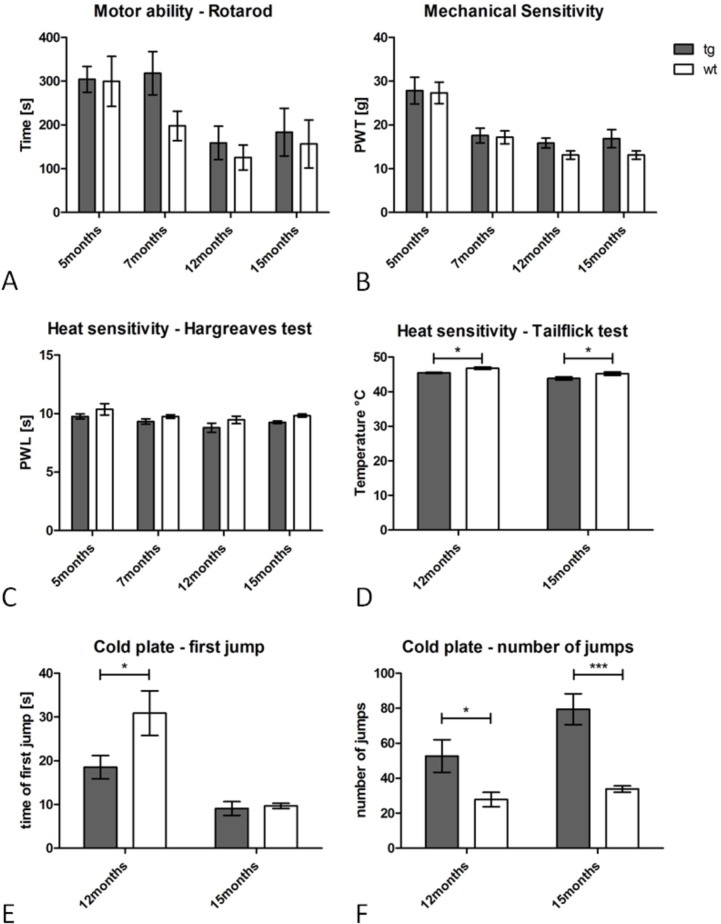
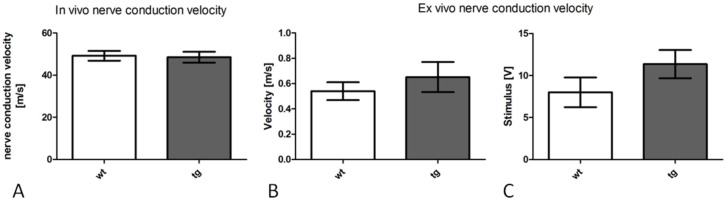
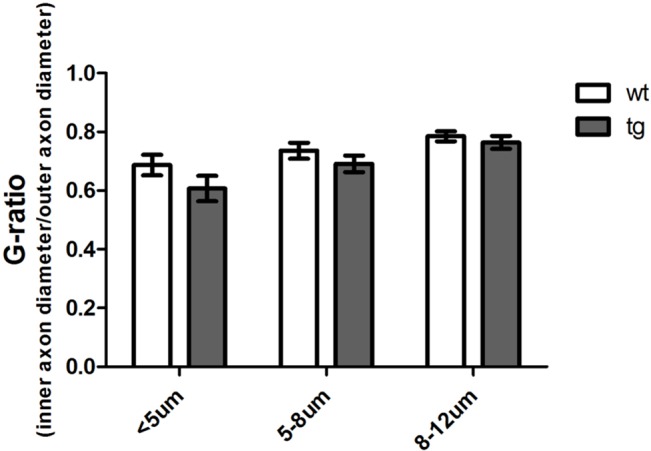
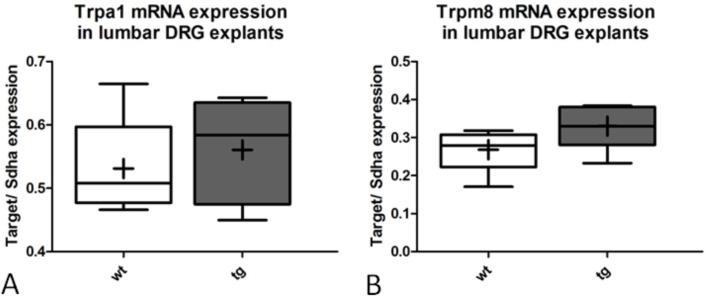
Results: To this end, heat/cold as well as mechanical sensitivity tests were performed. Furthermore, in vivo and ex vivo nerve conduction and the G-ratios of the sciatic nerve were analyzed, and thermosensitive ion channel mRNA expression in dorsal root ganglia (DRG) was assessed. The presence of human α-syn in Schwann cells was associated with subtle behavioral impairments. The G-ratio of the sciatic nerve, the conduction velocity of myelinated and unmyelinated primary afferents and the expression of thermosensitive ion channels in the sensory neurons, however, were similar to wildtype mice.
Conclusion: Our results suggest that the PNS appears to be affected by Schwann cell α-syn deposits in the PLP-α-syn MSA mouse model. However, there was no consistent evidence for functional PNS perturbations resulting from such α-syn aggregates suggesting a more central cause of the observed behavioral abnormalities. Nonetheless, our results do not exclude a causal role of α-syn in the pathogenesis of MSA associated peripheral neuropathy.
Conflict of interest statement
Figures
Similar articles
-
Overexpression of α-Synuclein by Oligodendrocytes in Transgenic Mice Does Not Recapitulate the Fibrillar Aggregation Seen in Multiple System Atrophy.Cells. 2020 Oct 29;9(11):2371. doi: 10.3390/cells9112371. Cells. 2020. PMID: 33138150 Free PMC article.
-
Oligodendroglial alpha-synucleinopathy and MSA-like cardiovascular autonomic failure: experimental evidence.Exp Neurol. 2013 Sep;247:531-6. doi: 10.1016/j.expneurol.2013.02.002. Epub 2013 Feb 8. Exp Neurol. 2013. PMID: 23399889 Free PMC article.
-
Targeted overexpression of human alpha-synuclein in oligodendroglia induces lesions linked to MSA-like progressive autonomic failure.Exp Neurol. 2010 Aug;224(2):459-64. doi: 10.1016/j.expneurol.2010.05.008. Epub 2010 May 21. Exp Neurol. 2010. PMID: 20493840 Free PMC article.
-
Insights into the pathogenesis of multiple system atrophy: focus on glial cytoplasmic inclusions.Transl Neurodegener. 2020 Feb 17;9:7. doi: 10.1186/s40035-020-0185-5. eCollection 2020. Transl Neurodegener. 2020. PMID: 32095235 Free PMC article. Review.
-
Neuropathology of multiple system atrophy: new thoughts about pathogenesis.Mov Disord. 2014 Dec;29(14):1720-41. doi: 10.1002/mds.26052. Epub 2014 Oct 9. Mov Disord. 2014. PMID: 25297524 Review.
Cited by
-
A microfabricated nerve-on-a-chip platform for rapid assessment of neural conduction in explanted peripheral nerve fibers.Nat Commun. 2018 Oct 23;9(1):4403. doi: 10.1038/s41467-018-06895-7. Nat Commun. 2018. PMID: 30353009 Free PMC article.
-
Prevalence and Characteristics of Polyneuropathy in Atypical Parkinsonian Syndromes: An Explorative Study.Brain Sci. 2021 Jun 30;11(7):879. doi: 10.3390/brainsci11070879. Brain Sci. 2021. PMID: 34209067 Free PMC article.
-
Multiple System Atrophy: An Oligodendroglioneural Synucleinopathy1.J Alzheimers Dis. 2018;62(3):1141-1179. doi: 10.3233/JAD-170397. J Alzheimers Dis. 2018. PMID: 28984582 Free PMC article. Review.
-
Impaired skeletal muscle health in Parkinsonian syndromes: clinical implications, mechanisms and potential treatments.J Cachexia Sarcopenia Muscle. 2023 Oct;14(5):1987-2002. doi: 10.1002/jcsm.13312. Epub 2023 Aug 13. J Cachexia Sarcopenia Muscle. 2023. PMID: 37574254 Free PMC article. Review.
-
An update on MSA: premotor and non-motor features open a window of opportunities for early diagnosis and intervention.J Neurol. 2020 Sep;267(9):2754-2770. doi: 10.1007/s00415-020-09881-6. Epub 2020 May 20. J Neurol. 2020. PMID: 32436100 Free PMC article. Review.
References
-
- Wenning GK, Fanciulli A. Multiple System Atrophy. 2014 ed: Springer; 2013.
Publication types
MeSH terms
Substances
Grants and funding
LinkOut - more resources
Full Text Sources
Other Literature Sources
Research Materials
Miscellaneous
