

Impact of library preparation protocols and template quantity on the metagenomic reconstruction of a mock microbial community
- PMID: 26496746
- PMCID: PMC4619416
- DOI: 10.1186/s12864-015-2063-6
Impact of library preparation protocols and template quantity on the metagenomic reconstruction of a mock microbial community
Abstract
Background: The rapid development of sequencing technologies has provided access to environments that were either once thought inhospitable to life altogether or that contain too few cells to be analyzed using genomics approaches. While 16S rRNA gene microbial community sequencing has revolutionized our understanding of community composition and diversity over time and space, it only provides a crude estimate of microbial functional and metabolic potential. Alternatively, shotgun metagenomics allows comprehensive sampling of all genetic material in an environment, without any underlying primer biases. Until recently, one of the major bottlenecks of shotgun metagenomics has been the requirement for large initial DNA template quantities during library preparation.
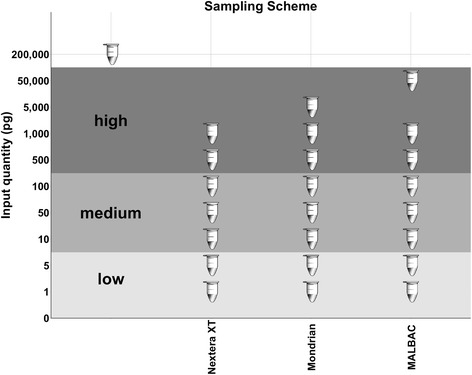
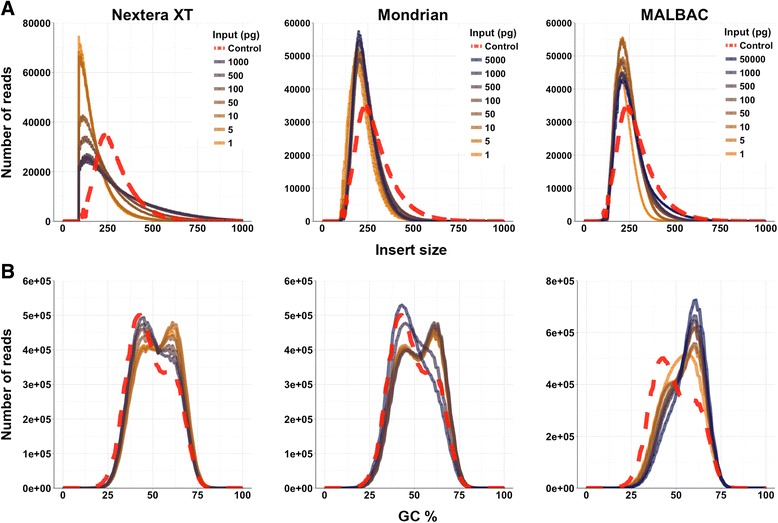
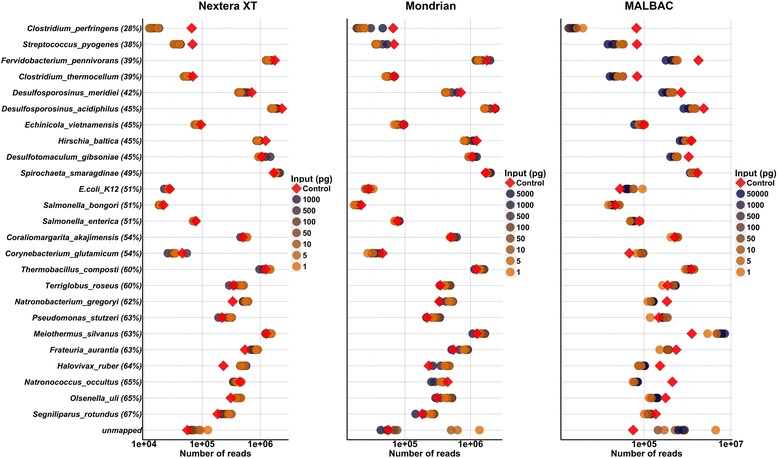
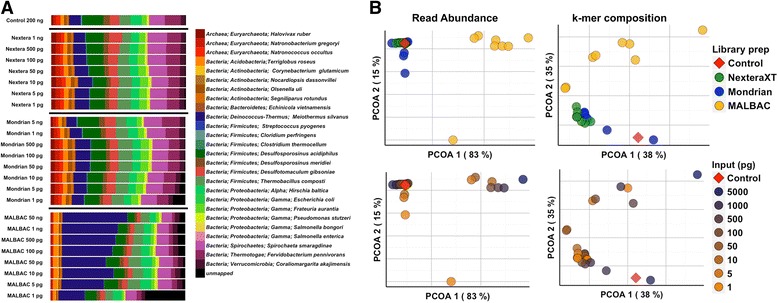
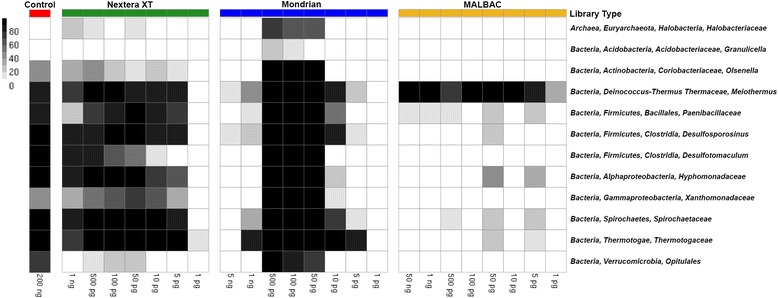
Results: Here, we investigate the effects of varying template concentrations across three low biomass library preparation protocols on their ability to accurately reconstruct a mock microbial community of known composition. We analyze the effects of input DNA quantity and library preparation method on library insert size, GC content, community composition, assembly quality and metagenomic binning. We found that library preparation method and the amount of starting material had significant impacts on the mock community metagenomes. In particular, GC content shifted towards more GC rich sequences at the lower input quantities regardless of library prep method, the number of low quality reads that could not be mapped to the reference genomes increased with decreasing input quantities, and the different library preparation methods had an impact on overall metagenomic community composition.
Conclusions: This benchmark study provides recommendations for library creation of representative and minimally biased metagenome shotgun sequencing, enabling insights into functional attributes of low biomass ecosystem microbial communities.
Figures
References
-
- Chivian D, Brodie EL, Alm EJ, Culley DE, Dehal PS, DeSantis TZ, et al. Environmental genomics reveals a single-species ecosystem deep within Earth. Science. 2008;275–8. http://doi.org/10.1126/science.1155495. - DOI - PubMed
-
- Duhaime MB, Deng L, Poulos BT, Sullivan MB. Towards quantitative metagenomics of wild viruses and other ultra-low concentration DNA samples: a rigorous assessment and optimization of the linker amplification method. Environ Microbiol. 2012;14(9):2526–37. doi: 10.1111/j.1462-2920.2012.02791.x. - DOI - PMC - PubMed
Publication types
MeSH terms
LinkOut - more resources
Full Text Sources
Other Literature Sources
Molecular Biology Databases
Miscellaneous
