. 2015 Oct;119(Pt A):52-72.
doi: 10.1016/j.brainresbull.2015.10.004. Epub 2015 Oct 20.

Cytoarchitecture and cortical connections of the anterior insula and adjacent frontal motor fields in the rhesus monkey

Affiliations

Cytoarchitecture and cortical connections of the anterior insula and adjacent frontal motor fields in the rhesus monkey

R J Morecraft et al. Brain Res Bull. 2015 Oct.

Abstract

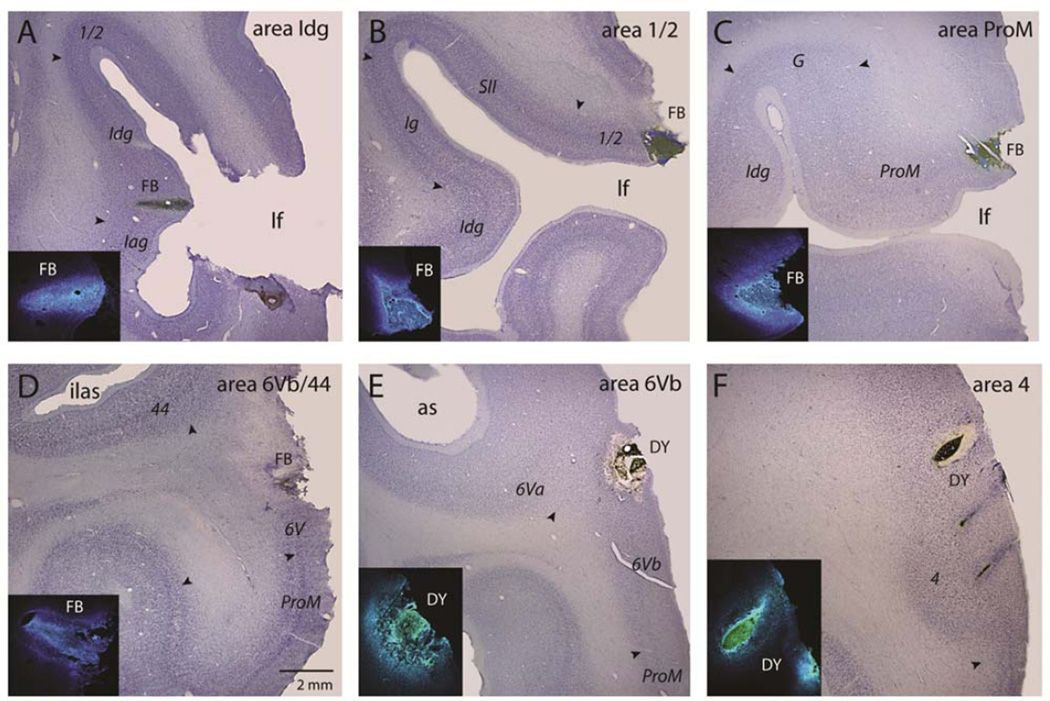
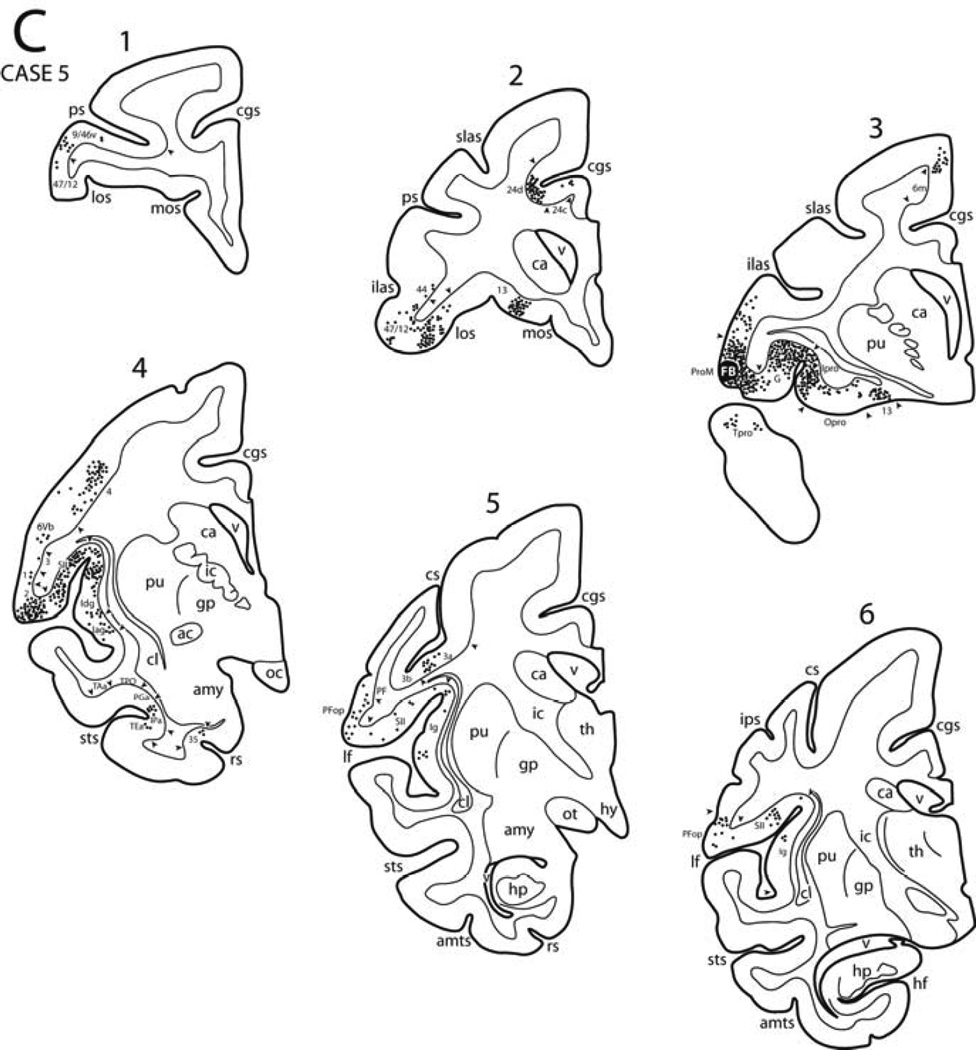
The cytoarchitecture and cortical connections of the ventral motor region are investigated using Nissl, and NeuN staining methods and the fluorescent retrograde tract tracing technique in the rhesus monkey. On the basis of gradual laminar differentiation, it is shown that the ventral motor region stems from the ventral proisocortical area (anterior insula and dorsal Sylvian opercular region). The cytoarchitecture of the ventral motor region is shown to progress in three lines, as we have recently shown for the dorsal motor region. Namely, root (anterior insular and dorsal Sylvian opercular area ProM), belt (ventral premotor cortex) and core (precentral motor cortex) lines. This stepwise architectonic organization is supported by the overall patterns of corticocortical connections. Areas in each line are sequentially interconnected (intralineal connections) and all lines are interconnected (interlinear connections). Moreover, root areas, as well as some of the belt areas of the ventral and dorsal trend are interconnected. The ventral motor region is also connected with the ventral somatosensory areas in a topographic manner. The root and belt areas of ventral motor region are connected with paralimbic, multimodal and prefrontal (outer belt) areas. In contrast, the core area has a comparatively more restricted pattern of corticocortical connections. This architectonic and connectional organization is consistent in part, with the functional organization of the ventral motor region as reported in behavioral and neuroimaging studies which include the mediation of facial expression and emotion, communication, phonic articulation, and language in human.

Keywords: Cerebral cortex; Frontal lobe; Limbic system; Motivation; Motor behavior; Orofacial movement.


Figures

Figure 1
Figure 1
Schematic representation of lateral (upper diagram) and medial (lower diagram) surfaces of the cerebral cortex of the rhesus monkey (Macaca mulatta) modified according to Morecraft et al., 2004. The architectonic areas depicted in these diagrams are based on the findings of several investigators: occipital (Paxinos et al., 2000; Pandya and Yeterian, 2010), parietal (Pandya and Seltzer, 1982), inferotemporal and superior temporal sulcus (Seltzer and Pandya, 1978; Desimone and Ungerleider, 1986), superior temporal gyrus and supratemporal plane (Pandya and Sanides, 1973; Krubitzer and Kaas, 1990), insular, parietotemporal opercular and frontotemporal opercular (Roberts and Akert, 1963, Jones and Burton, 1976; Mesulam and Mufson, 1982a; Krubitzer and Kaas, 1990; Krubitzer et al., 1995), lateral premotor (Barbas and Pandya 1987), prefrontal (Petrides and Pandya, 1994), cingulate (Morecraft and Van Hoesen 1992, 1998; Morecraft et al., 2004); and parahippocampal (Blatt et al., 2003) regions. The organization and location of the supplementary motor cortex (MII) is based on the observations of Morecraft and colleagues (McNeal et al., 2010; Morecraft et al., 2015a,b) and Luppino and co-workers (1993) and the pre-SMA region by Matelli and colleagues (Matelli et al. 1985, Luppino et al., 1993).
Figure 2
Figure 2
Bright-field photomicrographs of NeuN stained tissue sections showing the cytoarchitecture of the rostral insula, ventral lateral premotor, and ventral precentral regions. A, proisocortical insular cortex. B, area ProM. C, area 6Vb. D, area 6Va. E, area 4. Scale bar in panel A = 1 mm and applies to all panels. The asterisk in panels C and D show the location of an incipient layer IV. For abbreviations, see list.
Figure 3
Figure 3
Composite diagram to show the location of the Fast blue (FB) and diamidino-yellow (DY) injection site in Cases 1 through 9 (C1-C9) located in the insula, ventral lateral premotor and ventral precentral motor regions. For abbreviations, see list.
Figure 4
Figure 4
Low power photomicrographs of showing the location of FRT injections in Nissl stained tissue preparations in selected Cases. The inset in each panel is a higher power fluorescent image of the injection site. A, Case 1 (SDM66 FB). B, Case 4 (SDM69 FB). C, Case 5 (SDM40 FB). D, Case 6 (SDM39 FB). E, Case 8 (SDM39 DY). F, Case 9 (SDM8 DY). Scale bar = 1mm and applies to all Nissl stained images. For abbreviations, see list.
Figure 5
Figure 5
Diagrammatic representation of the lateral (A), medial and ventral (B) surfaces of the cerebral hemisphere to show the injection site (irregular black sphere) in the anterior insula and cortical distribution of labeled neurons (black dots) in Case 1.
Figure 6
Figure 6
Diagrammatic representation of the lateral (A), medial and ventral (B) surfaces of the cerebral hemisphere to show the injection site (irregular black sphere) in the anterior insula and cortical distribution of labeled neurons (black dots) in Case 2. Also shown are 5 representative coronal sections (C) taken at levels shown in panels A and B to depict the location of the injection site and the cortical distribution of labeled neurons.
Figure 7
Figure 7
Diagrammatic representation of the lateral (A), medial and ventral (B) surfaces of the cerebral hemisphere to show the injection site (irregular black sphere) in the precentral extension of are 2 and cortical distribution of labeled neurons (black dots) in Case 3.
Figure 8
Figure 8
Diagrammatic representation of the lateral (A), medial and ventral (B) surfaces of the cerebral hemisphere to show the injection site (irregular black sphere) in opercular area ProM and the cortical distribution of labeled neurons (black dots) in Case 5. Also shown are 6 representative coronal sections (C) taken at levels shown in panels A and B to depict the location of the injection site and the cortical distribution of labeled neurons.
Figure 8
Figure 8
Diagrammatic representation of the lateral (A), medial and ventral (B) surfaces of the cerebral hemisphere to show the injection site (irregular black sphere) in opercular area ProM and the cortical distribution of labeled neurons (black dots) in Case 5. Also shown are 6 representative coronal sections (C) taken at levels shown in panels A and B to depict the location of the injection site and the cortical distribution of labeled neurons.
Figure 9
Figure 9
Diagrammatic representation of the lateral (A), medial and ventral (B) surfaces of the cerebral hemisphere to show the injection site (irregular black sphere) in the ventral and rostral region of area 6Vb and cortical distribution of labeled neurons (black dots) in Case 6.
Figure 10
Figure 10
Diagrammatic representation of the lateral (A), medial and ventral (B) surfaces of the cerebral hemisphere to show the injection site (irregular black sphere) in the dorsal of area 6Vb and cortical distribution of labeled neurons (black dots) in Case 7.
Figure 11
Figure 11
Diagrammatic representation of the lateral (A), medial and ventral (B) surfaces of the cerebral hemisphere to show the injection site (irregular black sphere) in the rostral and dorsal region of area 6Vb and cortical distribution of labeled neurons (black dots) in Case 8. Also shown are 7 representative coronal sections (C) taken at levels shown in panels A and B to depict the location of the injection site and the cortical distribution of labeled neurons.
Figure 12
Figure 12
Diagrammatic representation of the lateral (A), medial and ventral (B) surfaces of the cerebral hemisphere to show the injection site (irregular black sphere) in the ventral region of the precentral cortex (area 4, orofacial representation of M1) and the cortical distribution of labeled neurons (black dots) in Case 9. Also shown are 5 representative coronal sections (C) taken at levels shown in panels A and B to depict the location of the injection site and the cortical distribution of labeled neurons.
Figure 13
Figure 13
Photomicrographs showing representative examples of FRT labeled cells in six selected Cases. A) Fast blue labeled cells in the perirhinal cortex (area 35) following an injection of FB in anterior dysgranular insula in Case 1. B) Fast blue labeled cells in prefrontal area 46 following an injection of FB in the precentral extension of areas 1–2 in Case 4. C) Fast blue labeled cells in the dysgranular insula following an injection of FB in ProM in Case 5.D) Fast blue labeled cells in prefrontal area 47/12 following an injection of FB in the ventral and rostral portion of area 6Vb in Case 6. E) Diamidino-yellow labeled cells in somatosensory area 2 following an injection of DY into dorsal part of area 6Vb in Case 7. F) Diamidino-yellow labeled cells in the rostral part of the supplementary motor cortex (MII or area 6m) following an injection of DY into the ventral part of MI (area 4) in Case 9. Scale bar in A = 200 µm and also applies to panels B, C, D and E. Scale bar in F = 100 µm.
Fig. 14
Fig. 14
A) Summary diagram illustrating the general plan of architectonic progression in each line (root, see green arrows; belt see blue arrows; core, see red arrow). B) Summary diagram showing the sequential intralinear connections of each line. The root line interconnections are illustrated by the bidirectional sequence of green arrows. The belt line of interconnections are shown by the bidirectional blue lines, and the core line interconnections by the bidirectional red arrow. C). Summary diagram depicting the interlineal connections of the root, belt and core lines. Note that each line is interconnected with 2 other lines. For example, the root line is interconnected with the belt and core lines while the belt line is interconnected with the core and root lines. Finally the core line is interconnected with both belt and root lines.
Fig. 15
Fig. 15
Summary diagrams showing the cortical afferents to the rostral insula (A), opercular area ProM (B), area 6VB (C), and ventral area 4 (D).

Similar articles

Cited by

References

    1. Andersen RA. Encoding of intention and spatial location in the posterior parietal cortex. Cereb Cortex. 1995;5:457–469. - PubMed
    1. Arce FI, Lee JC, Ross CF, Sessle BJ, Hatsopoulos NG. Directional information from neuronal ensembles in the primate orofacial sensorimotor cortex. J Neurophysiol. 2013;110:1357–1369. - PubMed
    1. Barbas H, Pandya DN. Architecture and frontal cortical connections of the premotor cortex (area 6) in the rhesus monkey. J Comp Neurol. 1987;256:211–228. - PubMed
    1. Barbas H, Pandya DN. Architecture and intrinsic connections of the prefrontal cortex in the rhesus monkey. J Comp Neurol. 1989;286:353–375. - PubMed
    1. Blatt GJ, Pandya DN, Rosene DL. Parcellation of cortical afferents to three distinct sectors in the parahippocampal gyrus of the rhesus monkey: an anatomical and neurophysiological study. J Comp Neurol. 2003;466:161–179. - PubMed

Publication types

MeSH terms

LinkOut - more resources