

Modelling the distribution and transmission intensity of lymphatic filariasis in sub-Saharan Africa prior to scaling up interventions: integrated use of geostatistical and mathematical modelling
- PMID: 26496983
- PMCID: PMC4620019
- DOI: 10.1186/s13071-015-1166-x
Modelling the distribution and transmission intensity of lymphatic filariasis in sub-Saharan Africa prior to scaling up interventions: integrated use of geostatistical and mathematical modelling
Abstract
Background: Lymphatic filariasis (LF) is one of the neglected tropical diseases targeted for global elimination. The ability to interrupt transmission is, partly, influenced by the underlying intensity of transmission and its geographical variation. This information can also help guide the design of targeted surveillance activities. The present study uses a combination of geostatistical and mathematical modelling to predict the prevalence and transmission intensity of LF prior to the implementation of large-scale control in sub-Saharan Africa.
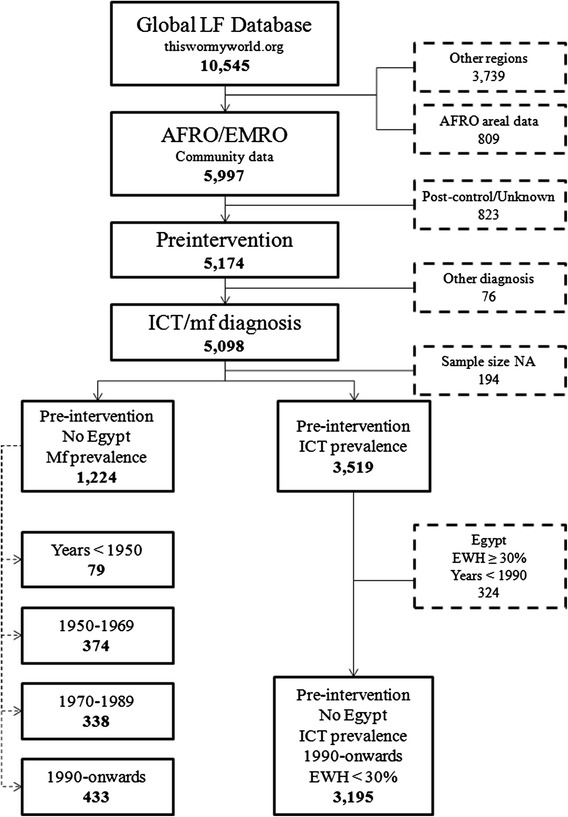
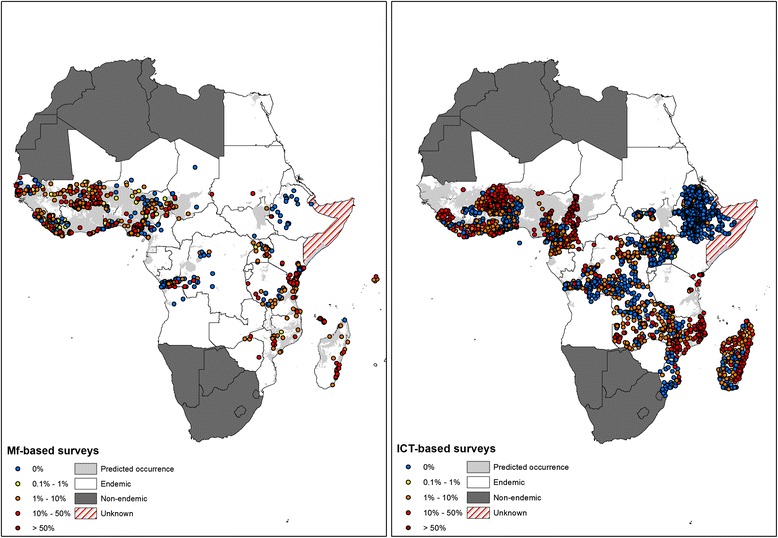
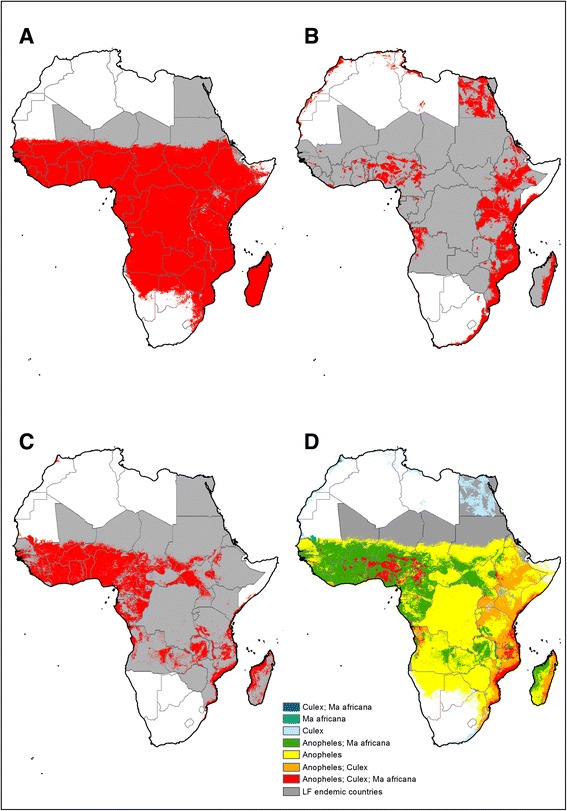
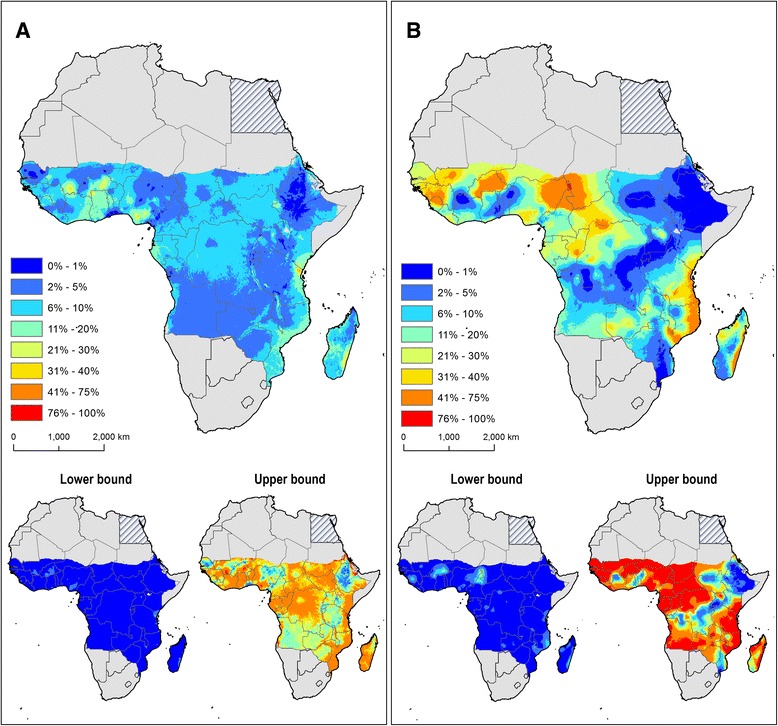
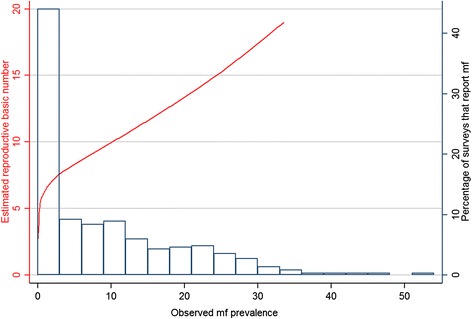
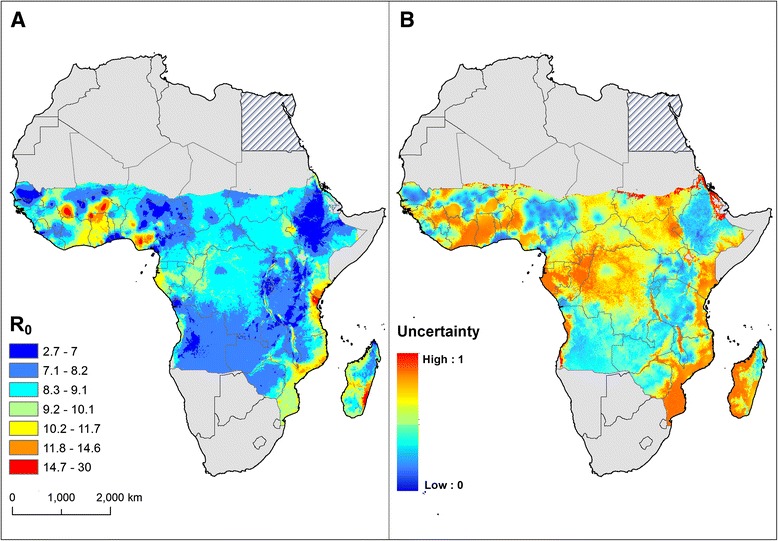
Methods: A systematic search of the literature was undertaken to identify surveys on the prevalence of Wuchereria bancrofti microfilaraemia (mf), based on blood smears, and on the prevalence of antigenaemia, based on the use of an immuno-chromatographic card test (ICT). Using a suite of environmental and demographic data, spatiotemporal multivariate models were fitted separately for mf prevalence and ICT-based prevalence within a Bayesian framework and used to make predictions for non-sampled areas. Maps of the dominant vector species of LF were also developed. The maps of predicted prevalence and vector distribution were linked to mathematical models of the transmission dynamics of LF to infer the intensity of transmission, quantified by the basic reproductive number (R0).
Results: The literature search identified 1267 surveys that provide suitable data on the prevalence of mf and 2817 surveys that report the prevalence of antigenaemia. Distinct spatial predictions arose from the models for mf prevalence and ICT-based prevalence, with a wider geographical distribution when using ICT-based data. The vector distribution maps demonstrated the spatial variation of LF vector species. Mathematical modelling showed that the reproduction number (R0) estimates vary from 2.7 to 30, with large variations between and within regions.
Conclusions: LF transmission is highly heterogeneous, and the developed maps can help guide intervention, monitoring and surveillance strategies as countries progress towards LF elimination.
Figures
References
-
- WHO . Report of an informal meeting on transmission assessment surveys for review of the training modules and coordination for country support. Geneva: World Health Organization; 2013.
-
- WHO . Monitoring and Epidemiological Assessment of Mass Drug Administration for the Global Programme to Eliminate Lymphatic Filariasis (GPELF) Geneva: World Health Organization; 2011.
Publication types
MeSH terms
Grants and funding
LinkOut - more resources
Full Text Sources
Other Literature Sources
