

Genome-wide DNA methylome variation in two genetically distinct chicken lines using MethylC-seq
- PMID: 26497311
- PMCID: PMC4619007
- DOI: 10.1186/s12864-015-2098-8
Genome-wide DNA methylome variation in two genetically distinct chicken lines using MethylC-seq
Abstract
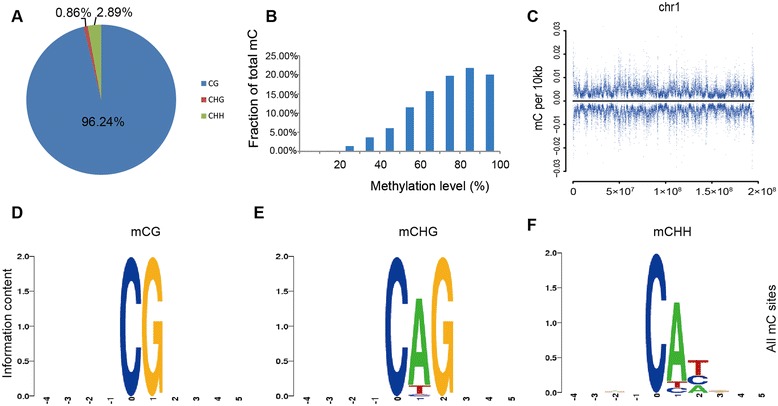
Background: DNA cytosine methylation is an important epigenetic modification that has significant effects on a variety of biological processes in animals. Avian species hold a crucial position in evolutionary history. In this study, we used whole-genome bisulfite sequencing (MethylC-seq) to generate single base methylation profiles of lungs in two genetically distinct and highly inbred chicken lines (Fayoumi and Leghorn) that differ in genetic resistance to multiple pathogens, and we explored the potential regulatory role of DNA methylation associated with immune response differences between the two chicken lines.
Methods: The MethylC-seq was used to generate single base DNA methylation profiles of Fayoumi and Leghorn birds. In addition, transcriptome profiling using RNA-seq from the same chickens and tissues were obtained to interrogate how DNA methylation regulates gene transcription on a genome-wide scale.
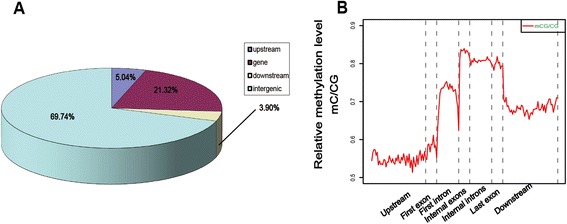
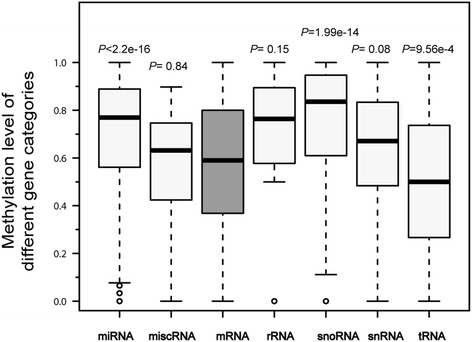
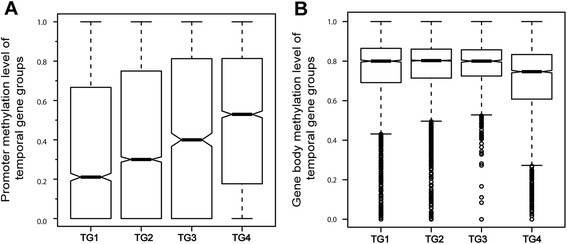
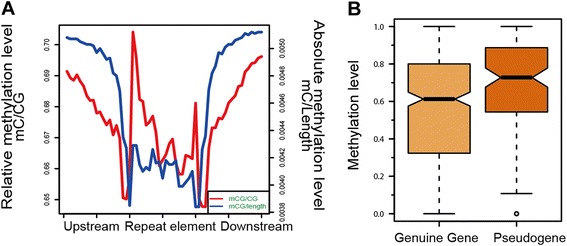
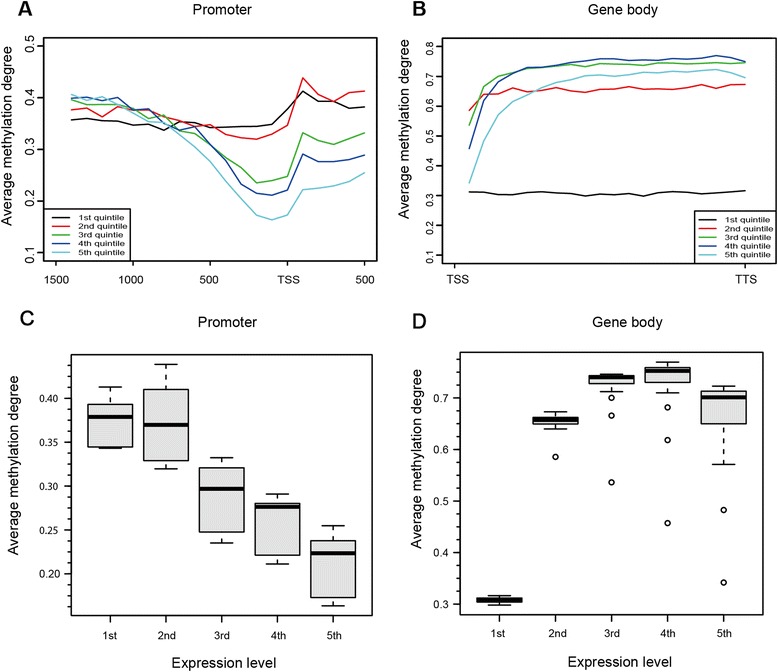
Results: The general DNA methylation pattern across different regions of genes was conserved compared to other species except for hyper-methylation of repeat elements, which was not observed in chicken. The methylation level of miRNA and pseudogene promoters was high, which indicates that silencing of these genes may be partially due to promoter hyper-methylation. Interestingly, the promoter regions of more recently evolved genes tended to be more highly methylated, whereas the gene body regions of evolutionarily conserved genes were more highly methylated than those of more recently evolved genes. Immune-related GO (Gene Ontology) terms were significantly enriched from genes within the differentially methylated regions (DMR) between Fayoumi and Leghorn, which implicates DNA methylation as one of the regulatory mechanisms modulating immune response differences between these lines.
Conclusions: This study establishes a single-base resolution DNA methylation profile of chicken lung and suggests a regulatory role of DNA methylation in controlling gene expression and maintaining genome transcription stability. Furthermore, profiling the DNA methylomes of two genetic lines that differ in disease resistance provides a unique opportunity to investigate the potential role of DNA methylation in host disease resistance. Our study provides a foundation for future studies on epigenetic modulation of host immune response to pathogens in chickens.
Figures
Similar articles
-
DNA methylome profiling at single-base resolution through bisulfite sequencing of 5mC-immunoprecipitated DNA.BMC Biotechnol. 2018 Feb 6;18(1):7. doi: 10.1186/s12896-017-0409-7. BMC Biotechnol. 2018. Retraction in: BMC Biotechnol. 2020 May 11;20(1):23. doi: 10.1186/s12896-020-00619-w. PMID: 29409498 Free PMC article. Retracted.
-
Mining cancer methylomes: prospects and challenges.Trends Genet. 2014 Feb;30(2):75-84. doi: 10.1016/j.tig.2013.11.004. Epub 2013 Dec 21. Trends Genet. 2014. PMID: 24368016 Review.
-
Studying the epigenome using next generation sequencing.J Med Genet. 2011 Nov;48(11):721-30. doi: 10.1136/jmedgenet-2011-100242. Epub 2011 Aug 8. J Med Genet. 2011. PMID: 21825079 Review.
-
Comparison of the genome-wide DNA methylation profiles between fast-growing and slow-growing broilers.PLoS One. 2013;8(2):e56411. doi: 10.1371/journal.pone.0056411. Epub 2013 Feb 18. PLoS One. 2013. PMID: 23441189 Free PMC article.
-
Systematic identification and annotation of human methylation marks based on bisulfite sequencing methylomes reveals distinct roles of cell type-specific hypomethylation in the regulation of cell identity genes.Nucleic Acids Res. 2016 Jan 8;44(1):75-94. doi: 10.1093/nar/gkv1332. Epub 2015 Dec 3. Nucleic Acids Res. 2016. PMID: 26635396 Free PMC article.
Cited by
-
Single nucleotide variant discovery of highly inbred Leghorn and Fayoumi chicken breeds using pooled whole genome resequencing data reveals insights into phenotype differences.BMC Genomics. 2016 Oct 19;17(1):812. doi: 10.1186/s12864-016-3147-7. BMC Genomics. 2016. PMID: 27760519 Free PMC article.
-
Non-coding regulatory elements: Potential roles in disease and the case of epilepsy.Neuropathol Appl Neurobiol. 2022 Apr;48(3):e12775. doi: 10.1111/nan.12775. Epub 2021 Dec 16. Neuropathol Appl Neurobiol. 2022. PMID: 34820881 Free PMC article. Review.
-
Chicken cecal DNA methylome alteration in the response to Salmonella enterica serovar Enteritidis inoculation.BMC Genomics. 2020 Nov 23;21(1):814. doi: 10.1186/s12864-020-07174-w. BMC Genomics. 2020. PMID: 33225883 Free PMC article.
-
Identification of DNA Methylation Differences in Pituitary Tissues of Sichuan White Geese Using Whole-Genome Bisulfite Sequencing (WGBS).Biology (Basel). 2025 Feb 3;14(2):154. doi: 10.3390/biology14020154. Biology (Basel). 2025. PMID: 40001922 Free PMC article.
-
Regional epigenetic differentiation of the Z Chromosome between sexes in a female heterogametic system.Genome Res. 2019 Oct;29(10):1673-1684. doi: 10.1101/gr.248641.119. Epub 2019 Sep 23. Genome Res. 2019. PMID: 31548356 Free PMC article.
References
Publication types
MeSH terms
Associated data
- Actions
LinkOut - more resources
Full Text Sources
Other Literature Sources
Molecular Biology Databases
