. 2015 Dec;130(6):829-43.
doi: 10.1007/s00401-015-1499-8. Epub 2015 Oct 24.

RCAN1 overexpression promotes age-dependent mitochondrial dysregulation related to neurodegeneration in Alzheimer's disease

Affiliations

RCAN1 overexpression promotes age-dependent mitochondrial dysregulation related to neurodegeneration in Alzheimer's disease

Helen Wong et al. Acta Neuropathol. 2015 Dec.

Abstract

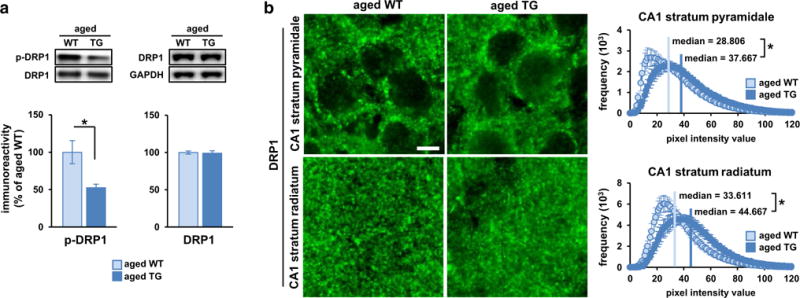
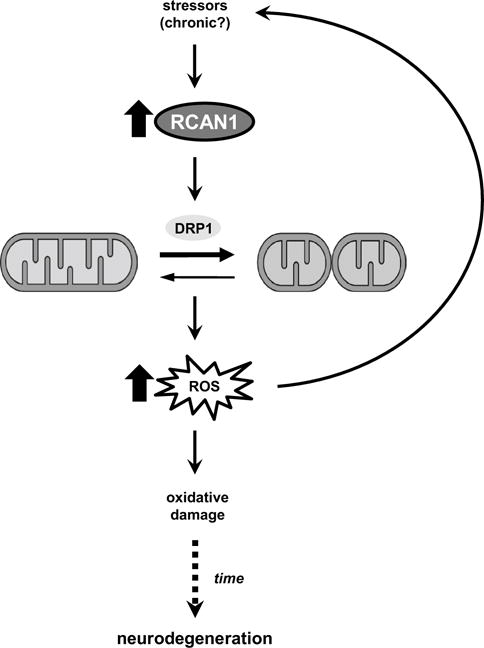
Aging is the largest risk factor for Alzheimer's disease (AD). Patients with Down syndrome (DS) develop symptoms consistent with early-onset AD, suggesting that overexpression of chromosome 21 genes such as Regulator of Calcineurin 1 (RCAN1) plays a role in AD pathogenesis. RCAN1 levels are increased in the brain of DS and AD patients but also in the human brain with normal aging. RCAN1 has been implicated in several neuronal functions, but whether its increased expression is correlative or causal in the aging-related progression of AD remains elusive. We show that brain-specific overexpression of the human RCAN1.1S isoform in mice promotes early age-dependent memory and synaptic plasticity deficits, tau pathology, and dysregulation of dynamin-related protein 1 (DRP1) activity associated with mitochondrial dysfunction and oxidative stress, reproducing key AD features. Based on these findings, we propose that chronic RCAN1 overexpression during aging alters DRP1-mediated mitochondrial fission and thus acts to promote AD-related progressive neurodegeneration.

Keywords: Aging; Calcineurin; DRP1; Fission; Mitochondria; RCAN1.


Figures

Fig. 1
Fig. 1
RCAN1.1S overexpression in the brain. a Western blot analysis of RCAN1 isoform expression in the brain of Alzheimer’s disease (AD) patients and age-matched controls (CTRL). RCAN1.1 proteins were elevated in AD vs. CTRL brains (RCAN1.1L t(21) = 9.954, p = .005; RCAN1.1S t(21) = 7.892, p = .011). N = 12 CTRL, 11 AD. b Correlational analyses showing human RCAN1.1L and RCAN1.1S levels increased with age in the CTRL group (RCAN1.1L r(10) = .736, p = .006; RCAN1.1S r(10) = .650, p = .022) but not in the AD group (RCAN1.1L r(9) = .309, p = .152; RCAN1.1S r(9) = −.235, p = .486). c Generation of RCAN1 transgenic (TG) mice with a floxed human RCAN1.1S transgene driven by Cre recombinase under the T-29 Camk2α promoter. d Representative western blot confirming RCAN1.1S overexpression in the hippocampus of Cre+/−; RCAN1Tg1a+/− (TG) mice compared with “wild-type” (WT) Cre−/−; RCAN1Tg1a+/− mice. e Representative western blot showing forebrain-specific RCAN1.1S overexpression in TG mice. OLF olfactory bulb, PFC prefrontal cortex, CTX cortex, HIP hippocampus, CER cerebellum, STR striatum. f Western blot analysis of age-related RCAN1 isoform expression in the mouse hippocampus. Exogenous human RCAN1.1S and endogenous murine RCAN1.1L protein levels increased from young (3–5 months old) to aged mice (12–14 months old). RCAN1.1S t(14) = −3.571, p = .003; RCAN1.1L F(3,28) = 11.429, p < .001; post hoc comparisons: all p < .05 except young TG vs. young WT (p = .503) and aged TG vs. aged WT (p = .955). N = 6–10 mice/group. Signal specificity confirmed using brain lysate from Rcan1 knockout (KO) mice. Normalized to β-actin. *p < .05
Fig. 2
Fig. 2
RCAN1.1S overexpression leads to age-dependent memory impairments. a Young TG mice displayed normal object recognition memory, measured as a preference index of significantly greater percent time spent exploring the novel object than familiar object (young WT t(32) = −4.063, p < .0001; young TG t(32) = −2.226, p = .033). Aged TG mice failed to show this preference while aged WT mice did (aged WT t(34) = −6.249, p < .0001; aged TG t(22) = .059, p = .954). These effects were not due to differences in total object exploration time (young t(32) = −.459, p = .649; aged t(29) = .074, p = .942), indicating impaired memory in aged TG mice. N = 13–18 mice/group. b Both young and aged TG mice displayed normal spatial learning and intact vision in the MWM (RM-ANOVA between-subjects, training day escape latency: main effect of genotype F(1,45) = .616, p = .437; main effect of age F(1,45) = .578, p = .451; main effect of interaction F(1,45) = .034, p = .855; visible platform day escape latency: F(1,45) = .211, p = .648). Young TG mice also displayed normal spatial memory assessed with the probe test, whereas aged TG mice were impaired, failing to display significantly more, c time spent and d platform crossings in the target vs. all other (L, opp, R) quadrants. Quadrant occupancy time: young WT F(3,32) = 5.509, p = .004; young TG F(3,44) = 12.085, p < .001; aged WT F(3,56) = 18.086, p < .001; aged TG F(3,48) = 9.886, p < .001; post hoc comparisons: all p < .05 except target vs. L in aged TG group (p = .822). Platform crossing frequency: young WT F(3,32) = 5.368, p = .004; young TG F(3,44) = 7.226, p = .001; aged WT F(3,56) = 11.659, p < .001; aged TG F(3,48) = 1.248, p = .309; post hoc comparisons only in young WT, young TG, and aged WT groups: all p < .05. N = 12–14 mice/group. e MWM probe test results were not due to differences in distance traveled (F(3,45) = 1.773, p = .166) or swim speed (F(3,45) = .961, p = .419). f Aged, but not young, TG mice displayed impaired contextual fear LTM, while fear acquisition and cued fear LTM were normal compared to WT littermates. Young TG vs. young WT: training F(1,20) = .323, p = .576; context LTM F(1,20) = .585, p = .453; cued LTM F(1,20) = .032, p = .861. Aged TG vs. aged WT: training F(1,22) = .029, p = .866; context LTM F(1,22) = 5.433, p = .029; cued LTM F(1,22) = .491, p = .491. N = 11–14 mice/group. *p < .05; ns not significant.
Fig. 3
Fig. 3
RCAN1.1S overexpression leads to age-dependent impairments in synaptic plasticity. a One train of HFS (100 Hz) evoked similar levels of E-LTP in hippocampal area CA1 of young and aged TG mice compared to WT littermates (young F(1,16) = .233, p = .636; aged F(1,37) = .899, p = .349). n = 8–20 slices/group, 5–7 mice/group. b Four trains of HFS evoked similar L-LTP levels between young WT and TG mice (F(1,14) = .067, p = .799). n = 7–9 slices/group, 5–7 mice/group. c L-LTP was significantly impaired in aged TG mice compared with WT littermates (F(1,30) = .612, p = .019). n = 14–18 slices/group, 5–7 mice/group. Representative fEPSP recordings before (1 gray trace) and after LTP induction (2 black trace) at the top in ac. d Western blot analysis of candidate RCAN1-regulated proteins important for synaptic plasticity in the aged mouse hippocampus. Impaired L-LTP in aged TG mice was not due to altered levels of phosphorylated GluA1 (p-GluA1) at S845 (t(19) = .037, p = .971) or S831 (t(19) = −.722, p = .479); total GluA1 (t(19) = .374, p = .713); NR2B phosphorylated at Y1472 (p-NR2B t(12) = .703, p = .495); total NR2B (t(12) = .832, p = .422); PSD95 (t(12) = 1.889, p = .083); synaptophysin (t(12) = .011, p = .991); CaMKII phosphorylated at T286 (p-CaMKII t(19) = .001, p = 1.00); or phosphorylated ERK at T202/Y204 (p-ERK1 t(19) = .143, p = .888; p-ERK2 t(19) = −.322, p = .751) in the hippocampus of aged TG mice compared to WT littermates. Phosphorylation signals normalized to the respective total protein levels; GluA1, NR2B, PSD95, and synaptophysin normalized to GAPDH. N = 6–12 mice/group. *p < .05
Fig. 4
Fig. 4
RCAN1.1S overexpression promotes early tau pathology in the hippocampus. Western blot analysis of early pathological tau phosphorylation in the hippocampus. Tau pathology detected with AT8 and AT180 antibodies were significantly increased in young TG vs. WT mice. No differences for these markers were detected between aged TG and WT mice. However, compared with young WT mice, AT8 and AT180 expression were increased in both aged TG and WT mice to similarly high levels in young TG mice, indicating RCAN1.1S overexpression accelerated the onset of early tau pathology in the hippocampus. AT8 F(3,19) = 3.765, p = .028; AT180 F(3,19) = 3.352, p = .041; post hoc comparisons: young TG vs. young WT: AT8 p = .031, AT180 p = .025; aged TG vs. aged WT: AT8 p = 1.000, AT180 p = .999; aged WT vs. young WT: AT8 p = .007, AT180 p = .009; aged TG vs. young WT: AT8 p = .032, AT180 p = .038. These results were not due to changes in total tau protein levels (summed ~50–53 kD signals; F(3,19) = 2.197, p = .122). AT8 and AT180 immunoreactivity normalized to total tau levels and total tau to GAPDH. N = 4–8 mice/group. *p < .05
Fig. 5
Fig. 5
RCAN1.1S overexpression promotes mitochondria-derived oxidative stress in the brain. a Endogenous ROS detected with DHE in the CA1 and DG of hippocampal slices were equally low in young TG and WT littermates and aged WT mice. By contrast, aged TG mice showed robust cellular ROS levels in the hippocampus. CA1 F(3,32) = 14.738, p < .001; DG F(3,32) = 8.139, p < .001; post hoc comparisons: young WT vs. young TG: CA1 p = 1.000, DG p = .980; aged WT vs. young WT: CA1 p = .967, DG p = .975; aged TG vs. aged WT: CA1 p < .0001, DG p = .006. N = 3 mice/group, 3 slices/mouse. Scale bar 50 μm. b Mitochondria-derived ROS detected with MitoSOX were significantly elevated in the CA1 and DG of hippocampal slices from aged TG mice (CA1 t(38) = 2.113, p = .041; DG t(38) = 3.153, p = .003). Hoechst nuclear stain. N = 5 mice/group, 4 slices/mouse. Scale bar 50 μm. c Western blot analysis of protein carbonyl levels as a marker of protein oxidation in mitochondria-enriched hippocampal lysates from aged TG and WT mice. Aged TG mice exhibited significantly greater protein carbonylation, indicating greater oxidative stress, than aged WT mice (t(19) = −2.272, p = .035). Protein carbonyl levels were quantified as immunoreactivity of carbonylated proteins between 10 and 260 kD normalized to VDAC1 levels per lane. N = 9–12 mice/group. d Western blot analysis showing no difference in total VDAC1 levels that could explain the increased protein carbonylation in aged TG mice (t(13) = −.066, p = .948). Normalized to GAPDH. N = 9–12 mice/group. *p < .05
Fig. 6
Fig. 6
RCAN1 TG mice exhibit aging-related mitochondrial dysfunction. a Acute MitoQ treatment of hippocampal slices did not restore L-LTP in aged TG mice to WT levels (F(3,52) = 3.183, p = .031; main effect of genotype F(1,56) = 8.973, p = .004; main effect of treatment F(1,56) = .001, p = .975; main effect of interaction F(3,52) = .048, p = .827). n = 11–18 slices/group, 5 mice/genotype. b Disrupting mitochondrial function with antimycin (ant) treatment of hippocampal slices impaired E-LTP significantly more in aged TG than in WT littermates compared with vehicle (veh) treatment, revealing increased age-dependent mitochondrial dysfunction when RCAN1.1S is overexpressed (F(3,71) = 31.089, p < .001; main effect of genotype F(1,71) = 4.111, p = .046; main effect of treatment F(1,71) = 80.609, p < .0001; main effect of interaction F(3,71) = 4.685, p = .034; post hoc aged TG + ant vs. aged WT + ant: p = .026). n = 17–21 slices/group, 5–7 mice/genotype. Representative fEPSP recordings before (1 gray trace) and after LTP induction (2 black trace) at the top in a and b. Mean fEPSP slopes recorded during last 20 min post-LTP induction at the right in a and b. c Mitochondrial membrane potential measured with JC-1 was abnormally hyperpolarized in hippocampal area CA1 of aged TG mice compared with WT littermates, indicating mitochondrial dysfunction (t(34) = −2.919, p = .006). JC-1 fluorescence intensity was quantified and normalized as a ratio of red (em590) to green (em530) fluorescence. Scale bar 10 μm. *p < .05
Fig. 7
Fig. 7
RCAN1.1S overexpression during aging alters dynamin-related protein 1 (DRP1) activity. a Western blot analysis showing reduced DRP1 phosphorylation at S637 (p-DRP1), normalized to DRP1 levels, in the hippocampus of aged TG vs. WT littermates (t(8) = −2.927, p = .019). N = 5 mice/group. This reduction was not due to a difference in total DRP1 levels, normalized to GAPDH, between the genotypes (t(13) = −.264, p = .796). N = 6–9 mice/group. b Reduced p-DRP1 levels corresponded to more diffuse sub-cellular localization of DRP1 in both the CA1 stratum pyramidale and stratum radiatum of aged TG vs. WT littermates. The median DRP1 pixel intensity value was significantly higher for aged TG mice than WT controls, indicating more diffuse DRP1 signal in the aged TG hippocampus (CA1-SP t(34) = −2.147, p = .039; CA1-SR t(34) = −2.508, p = .017). N = 6 mice/group, 3 slices/mouse. Scale bar 5 μm. *p < .05
Fig. 8
Fig. 8
RCAN1.1S overexpression during aging shifts mitochondria toward fission in the brain. a Representative images of mitochondria in the CA1 stratum pyramidale stained by the inner mitochondrial membrane marker ANT1. Insets highly fragmented perinuclear mitochondria in aged RCAN1 TG mice compared with WT littermates and the young group. Hoechst nuclear stain. Scale bar 5 μm. b Quantification of mitochondria sizes by measuring the pixel areas of ANT1 signal confirmed that aged WT mice and the young group were similar while aged TG mice had significantly more small (0–200 μm2) mitochondria in the hippocampus (F(3,24 = 5.287, p = .006; post hoc comparisons: aged TG vs. aged WT: p = .031; aged TG vs. young WT: p = .015; aged TG vs. young TG: p = .008 young WT vs. young TG: p = .990; young WT vs. aged WT: p = .999; aged WT vs. young TG: p = .977). N = 3–4 mice/group, 2 slices/mouse. c No significant differences in total mitochondria area measured as the sum pixel area of ANT1 signal were detected between any groups, indicating that the higher frequency of small mitochondria in aged TG mice likely resulted from increased fission (F(3,24 = .238, p = .869). d Western blot analysis showing that altered mitochondrial morphology in the hippocampus of aged TG mice was not due to a difference in total ANT1 levels compared to WT littermates and the young group (F(3,19 = .785, p = .517). Normalized to GAPDH. N = 4–9 mice/group. *p < .05
Fig. 9
Fig. 9
Schematic model of RCAN1 signaling in AD-related progressive neurodegeneration. Exposure to chronic stressors during aging may cause RCAN1 protein to accumulate in the brain and promote mitochondrial dysfunction and excessive ROS levels. Oxidative damage from excess ROS over time may then trigger AD-related neurodegeneration.

Comment in

Similar articles

Cited by

References

    1. Barria A, Muller D, Derkach V, Griffith LC, Soderling TR. Regulatory phosphorylation of AMPA-type glutamate receptors by CaM-KII during long-term potentiation. Science. 1997;276:2042–2045. - PubMed
    1. Bhoiwala DL, Koleilat I, Qian J, Beyer B, Hushmendy SF, Mathew A, Bhoiwala DL, Ferland RJ, Crawford DR. Overexpression of RCAN1 isoform 4 in mouse neurons leads to a moderate behavioral impairment. Neurol Res. 2013;35:79–89. doi: 10.1179/1743132812Y.0000000117. - DOI - PubMed
    1. Bishop NA, Lu T, Yankner BA. Neural mechanisms of ageing and cognitive decline. Nature. 2010;464:529–535. doi: 10.1038/nature08983. - DOI - PMC - PubMed
    1. Burke SN, Barnes CA. Neural plasticity in the ageing brain. Nat Rev Neurosci. 2006;7:30–40. doi: 10.1038/nrn1809. - DOI - PubMed
    1. Cereghetti GM, Stangherlin A, Martins de Brito O, Chang CR, Blackstone C, Bernardi P, Scorrano L. Dephosphorylation by calcineurin regulates translocation of Drp1 to mitochondria. Proc Natl Acad Sci USA. 2008;105:15803–15808. doi: 10.1073/pnas.0808249105. - DOI - PMC - PubMed

Publication types

MeSH terms