Clinical Trial
. 2015 Dec 8;6(39):41736-49.
doi: 10.18632/oncotarget.6153.

A putative biomarker signature for clinically effective AKT inhibition: correlation of in vitro, in vivo and clinical data identifies the importance of modulation of the mTORC1 pathway

Affiliations
Clinical Trial

A putative biomarker signature for clinically effective AKT inhibition: correlation of in vitro, in vivo and clinical data identifies the importance of modulation of the mTORC1 pathway

Azadeh Cheraghchi-Bashi et al. Oncotarget. .

Abstract

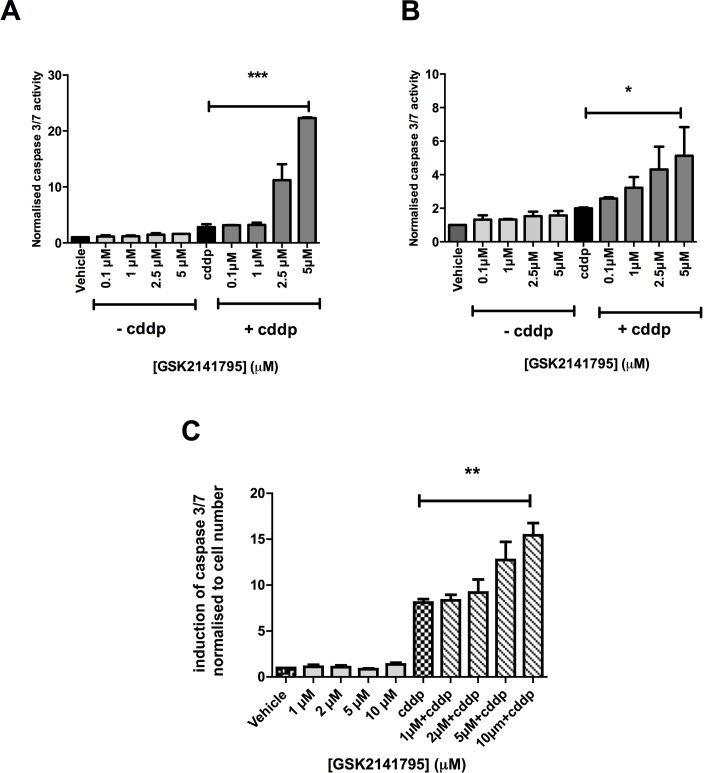
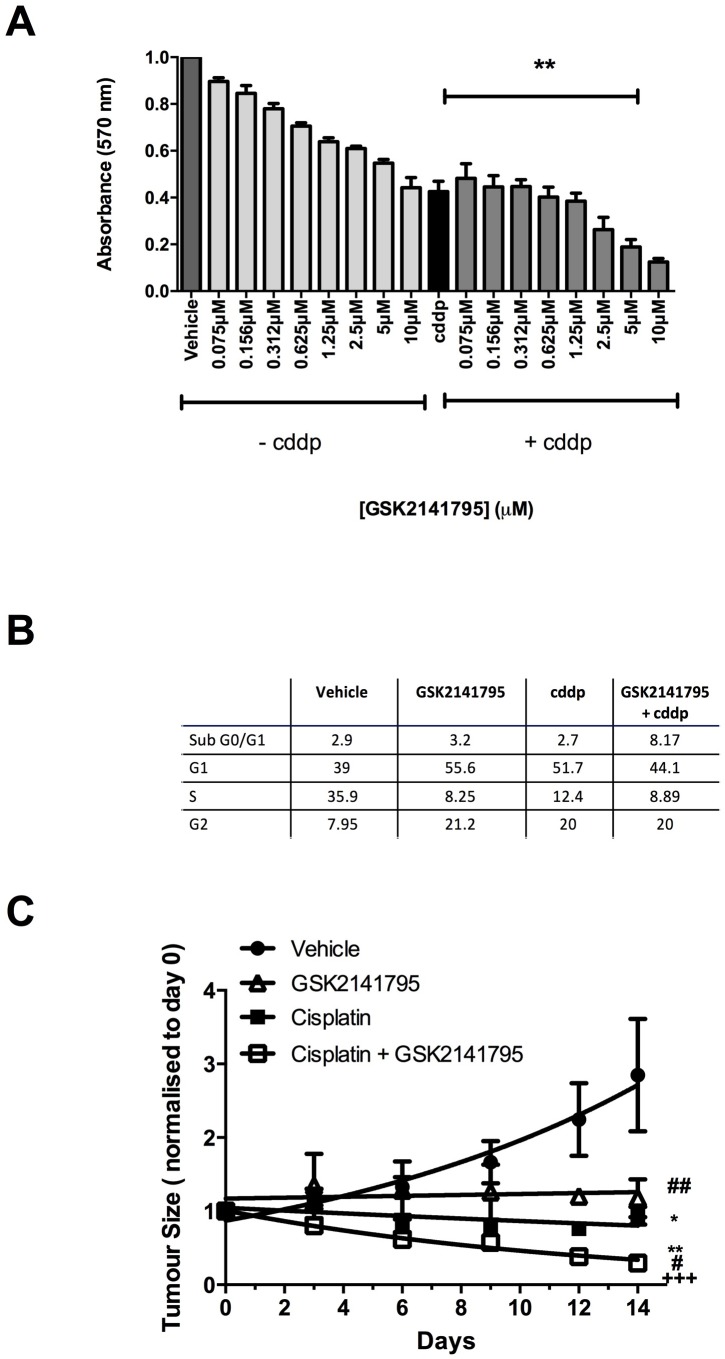
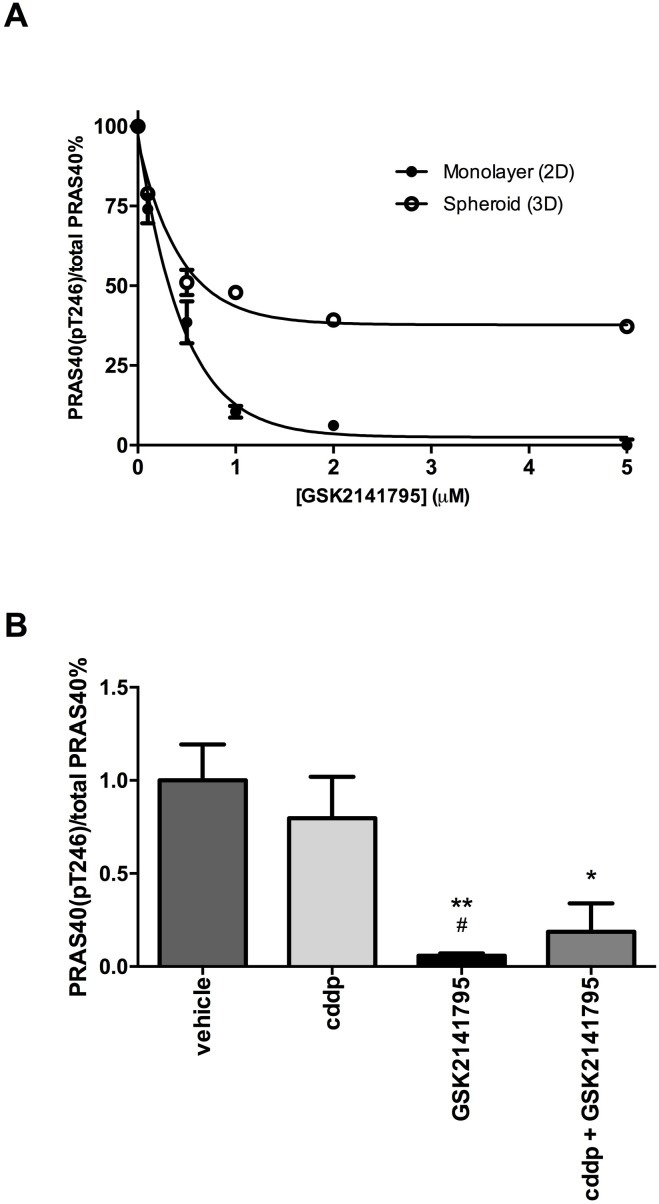
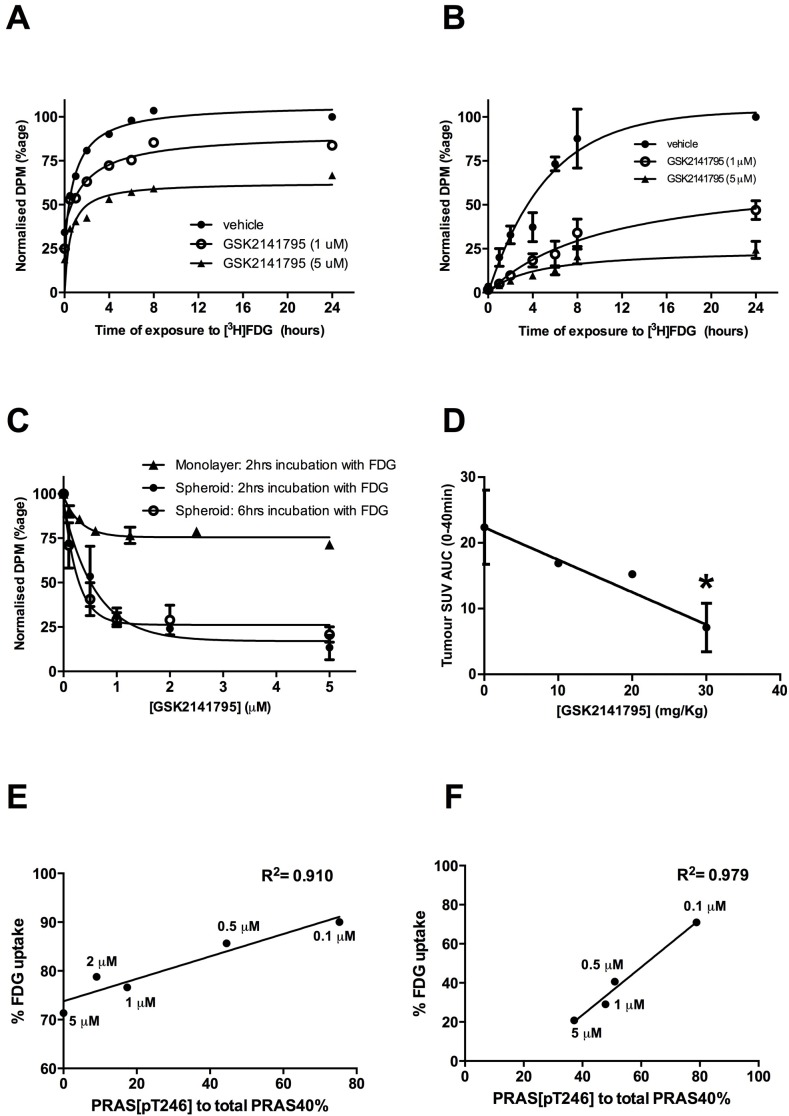
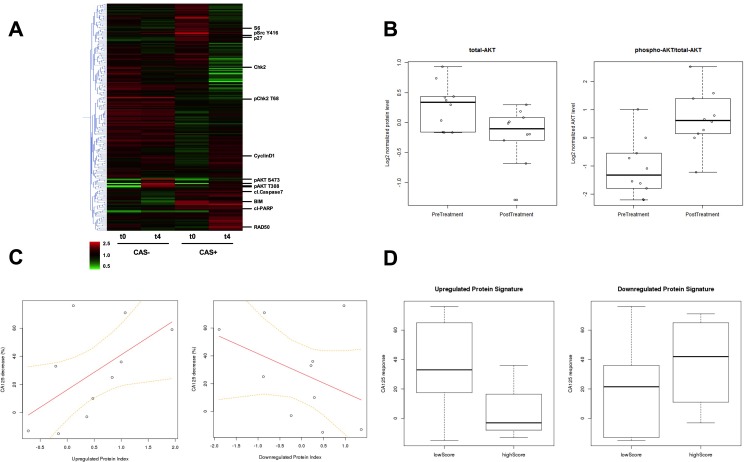
Our identification of dysregulation of the AKT pathway in ovarian cancer as a platinum resistance specific event led to a comprehensive analysis of in vitro, in vivo and clinical behaviour of the AKT inhibitor GSK2141795. Proteomic biomarker signatures correlating with effects of GSK2141795 were developed using in vitro and in vivo models, well characterised for related molecular, phenotypic and imaging endpoints. Signatures were validated in temporally paired biopsies from patients treated with GSK2141795 in a clinical study. GSK2141795 caused growth-arrest as single agent in vitro, enhanced cisplatin-induced apoptosis in vitro and reduced tumour volume in combination with platinum in vivo. GSK2141795 treatment in vitro and in vivo resulted in ~50-90% decrease in phospho-PRAS40 and 20-80% decrease in fluoro-deoxyglucose (FDG) uptake. Proteomic analysis of GSK2141795 in vitro and in vivo identified a signature of pathway inhibition including changes in AKT and p38 phosphorylation and total Bim, IGF1R, AR and YB1 levels. In patient biopsies, prior to treatment with GSK2141795 in a phase 1 clinical trial, this signature was predictive of post-treatment changes in the response marker CA125. Development of this signature represents an opportunity to demonstrate the clinical importance of AKT inhibition for re-sensitisation of platinum resistant ovarian cancer to platinum.

Keywords: AKT; biomarkers; ovarian cancer; platinum resistance; proteomics.


Conflict of interest statement

DISCLOSURE OF CONFLICTS OF INTEREST

All employees of GlaxoSmithKline are identified by their affiliations.

Figures

Figure 1
Figure 1. Caspase 3/7 activity in SKOV3 and PEO4 cells exposed to GSK2141795 as a single agent or in combination with cisplatin
SKOV3 and PEO4 monolayers (A. and B., respectively) and SKOV3 spheroids C. were pre-treated with a range of concentrations of GSK2141795, 1 hour prior to treatment with cisplatin (cddp; 25 μM). Induction of caspase 3/7 activity was assessed at 24 hours following the initiation of the treatment for the monolayers A. and B. and at 72 hours for the spheroid C.. Data shown are the means ± SEM of 3-4 experiments performed in triplicate. *p < 0.05, **p < 0.01, ***p < 0.001 (paired t-test).
Figure 2
Figure 2. Effect of GSK2141795 either alone or in combination with cisplatin on the viability, cell cycle and tumor growth of SKOV3 cells
SKOV3 cells were exposed to a range of GSK2141795 concentrations (0.075 - 10 μM) either as a single agent or in combination with cisplatin (cddp; 25 μM) for 72 hours, when cell viability was measured using MTT A. Cell cycle analysis of SKOV3 cells following treatment with GSK2141795 as a single agent (5 μM) or in combination with cisplatin (25 μM) for 24 hours B. SKOV3 tumour-bearing mice were dosed daily with GSK2141795 (30 mg/Kg; oral) or vehicle ± biweekly cisplatin (1.5 mg/Kg; intraperitonal) for 14 days C.. Data shown in A. and B. are the means ± SEM of 3-4 experiments performed in triplicate, and in C. the mean ± SEM for n = 8 tumours/treatment, *p < 0.05, **p < 0.01, ***p < 0.001 (paired t-test), where the symbols *, # and + represent significant differences when compared to vehicle, cisplatin and GSK2141795 data at 14 days, respectively.
Figure 3
Figure 3. Inhibition of PRAS40 phosphorylation by GSK2141795 in SKOV3 monolayers, spheroids and xenografts
Protein concentration of phospho-PRAS40 (Thr246) and total PRAS40 was determined by enzyme-linked immunosorbent assay (ELISA) after 72hr treatment of SKOV3 cells with a range of concentrations of GSK2141795 (0.01 - 5 μM) in both monolayers and spheroids A.. GSK2141795 (30 mg/Kg) abolished phosphorylation of PRAS40 at Thr246, both as single agent and in combination with cisplatin (cddp), in SKOV3 tumour xenografts following 14 days of treatment B.. Data are presented as a phospho-PRAS40 / total PRAS40 decrease relative to untreated or vehicle treated samples. Data shown in A. are the means ± SEM of n = 2 experiments performed in triplicate, and in B. the mean ± SEM for n = 5 animals (tumours) / treatment. *p < 0.05 and **p < 0.01, where the symbols * and # represent significant differences when compared to vehicle and cisplatin data, respectively (unpaired t-test, two tailed).
Figure 4
Figure 4. Effect of GSK2141795 on FDG uptake in SKOV3 monolayer, spheroids and mouse xenografts
Time-course of [3H]FDG uptake in SKOV3 monolayers (N = 3) A. and spheroids (N = 3, experiments performed in triplicate ± SEM) B. pre-incubated with either vehicle or GSK2141795 (1 and 5 μM) for 48 hours; Dose-dependent effect of GSK2141795 on the uptake of [3H]FDG into SKOV3 monolayers following 2 hours incubation with [3H]FDG; SKOV3 spheroids following 2 and 6 hours incubation with [3H]FDG (N = 3, experiments performed in triplicate ± SEM) C.; and uptake of [18F]FDG into tumours of SKOV3 xenografted mice following 5 hours drug treatment (10 - 30 mg/Kg; n = 3 per dose except for 20 mg/Kg where n = 1), *p < 0.05 compared to vehicle treated animals (unpaired t-test) D.. Pearson correlation between expression levels of phospho-PRAS40 (Thr246) and [3H]FDG uptake into SKOV3 monolayers E. and spheroids F. following treatment with GSK2141795. SKOV3 monolayers and spheroids were treated with varying concentrations of GSK2141795 for 48 hours. Phospho-PRAS40 (Thr246) and [3H]FDG uptake were analysed as described in the methods section. Abbreviations: DPM = decays per minute; SUV = standardised uptake values; AUC = area under the curve.
Figure 5
Figure 5
A. Hierarchical clustering heatmap of protein expression detected in RPPA from pre-treatment and W4 on-treatment biopsies. CAS+: patient group with clinical activity signal, and CAS-: patient group with no clinical activity signal are indicated. t0: pre-treatment and t4: W4 on-treatment biopsy samples. The expression level for each protein from each patient at a given time point in the CAS or non-CAS population is averaged and displayed in the heatmap, with data for each protein median centered. Red indicates an increase in expression and green represents a decrease in expression with respect to the median. Examples of significant proteins identified in the analysis are indicated individually. B. Comparison of the average levels of total AKT and the ratio of phospho-AKT/total-AKT between pre-treatment biopsies (n = 12) and the biopsies taken following 4 weeks of treatment with GSK2141795 (n = 10) for all patients. Total AKT decrease student's t-test p = 0.02; phospho-AKT/total-AKT increase student's t-test p = 0.006 C. Correlation between clinical response to administration of GSK2141795 and pharmacologically-induced change in protein expression profile for AKT-inhibition signature. Percentage decrease in patients' CA125 levels is plotted against the difference in AKT-inhibition proteomic signature z-scores between pre-treatment biopsy and the biopsy taken following 4 weeks of treatment with GSK2141795 (n = 10 pairs) for the up- and down-regulated protein signatures (Table 1). T distribution of Pearson correlation coefficient gives p = 0.082 for up-regulated protein signature. D. Comparison of treatment-induced decrease in CA125 (as a percentage of pre-treatment level) following 4 weeks of treatment with GSK2141795 in patients with low versus high pre-treatment levels of the up- and down-regulated AKT-inhibition proteomic signatures (Table 1). T distribution of Pearson correlation coefficient between CA125 decrease and up-regulated proteomic signature score gives p = 0.041. CAS: clinical activity signal. CAS+ >30% CA125 decrease. CAS- < 30% CA125 decrease.

Similar articles

Cited by

References

    1. Vaughan S, Coward JI, Bast RC, Jr, Berchuck A, Berek JS, Brenton JD, Coukos G, Crum CC, Drapkin R, Etemadmoghadam D, et al. Rethinking ovarian cancer: recommendations for improving outcomes. Nature reviews Cancer. 2011;11:719–725. - PMC - PubMed
    1. Bookman MA, Brady MF, McGuire WP, Harper PG, Alberts DS, Friedlander M, Colombo N, Fowler JM, Argenta PA, De Geest K, et al. Evaluation of new platinum-based treatment regimens in advanced-stage ovarian cancer: a Phase III Trial of the Gynecologic Cancer Intergroup. J Clin Oncol. 2009;27:1419–1425. - PMC - PubMed
    1. Bowtell DD. The genesis and evolution of high-grade serous ovarian cancer. Nature reviews Cancer. 2010;10:803–808. - PubMed
    1. Bast RC, Jr, Mills GB. Dissecting “PI3Kness”: the complexity of personalized therapy for ovarian cancer. Cancer Discov. 2012;2:16–18. - PMC - PubMed
    1. Stronach EA, Chen M, Maginn EN, Agarwal R, Mills GB, Wasan H, Gabra H. DNA-PK mediates AKT activation and apoptosis inhibition in clinically acquired platinum resistance. Neoplasia. 2011;13:1069–1080. - PMC - PubMed

Publication types

MeSH terms