

Suppression of A549 cell proliferation and metastasis by calycosin via inhibition of the PKC‑α/ERK1/2 pathway: An in vitro investigation
- PMID: 26498639
- PMCID: PMC4758323
- DOI: 10.3892/mmr.2015.4449
Suppression of A549 cell proliferation and metastasis by calycosin via inhibition of the PKC‑α/ERK1/2 pathway: An in vitro investigation
Erratum in
-
Suppression of A549 cell proliferation and metastasis by calycosin via inhibition of the PKC-α/ERK1/2 pathway: An in vitro investigation.Mol Med Rep. 2016 Apr;13(4):3709-10. doi: 10.3892/mmr.2016.4976. Epub 2016 Mar 4. Mol Med Rep. 2016. PMID: 26956998 Free PMC article.
Abstract
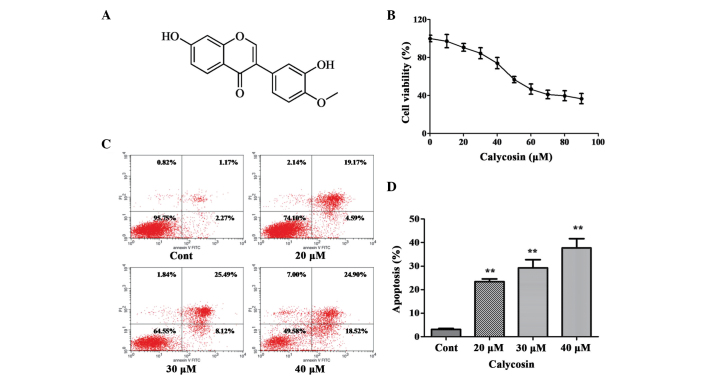
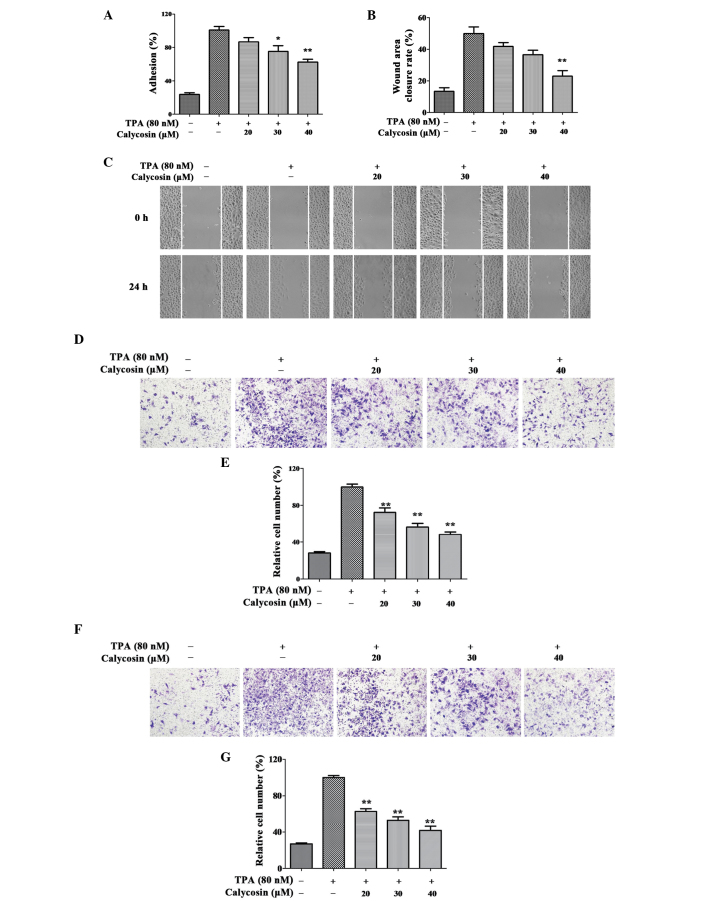
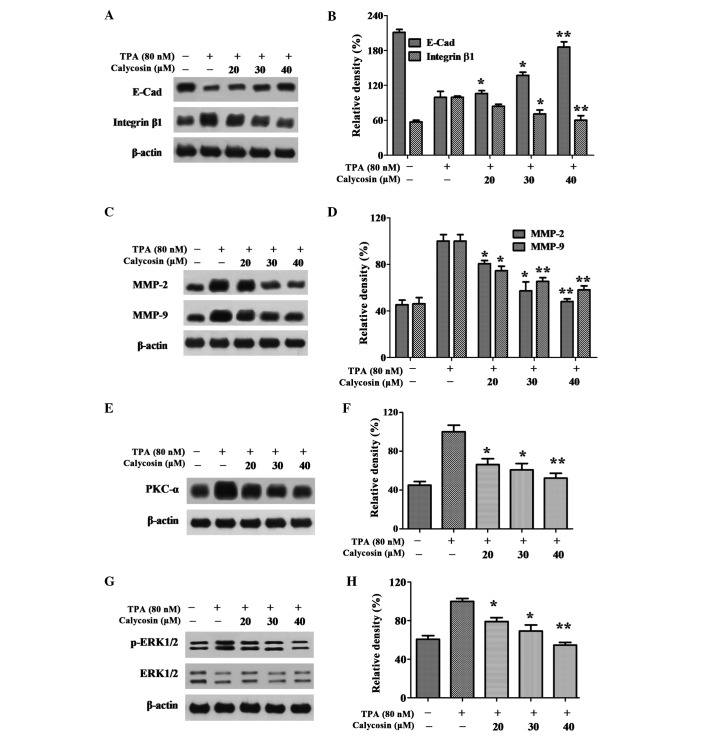
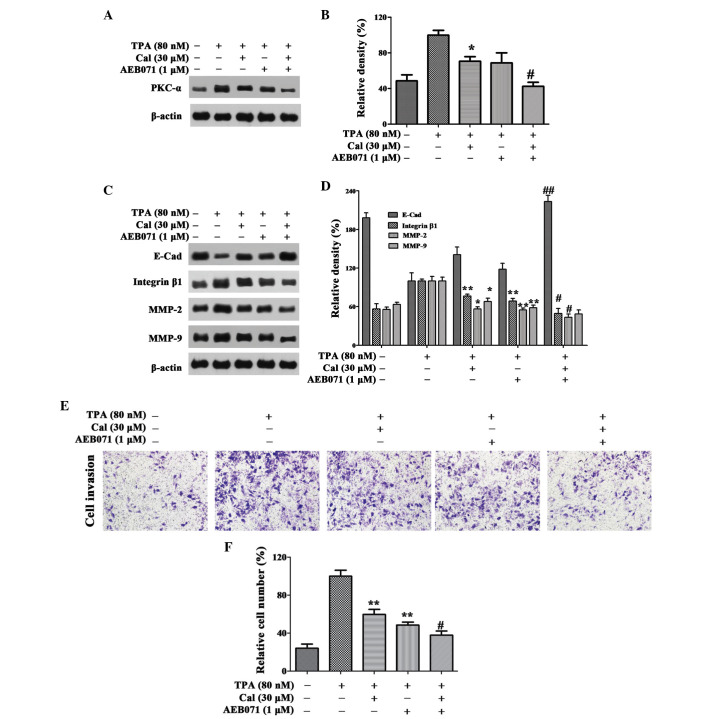
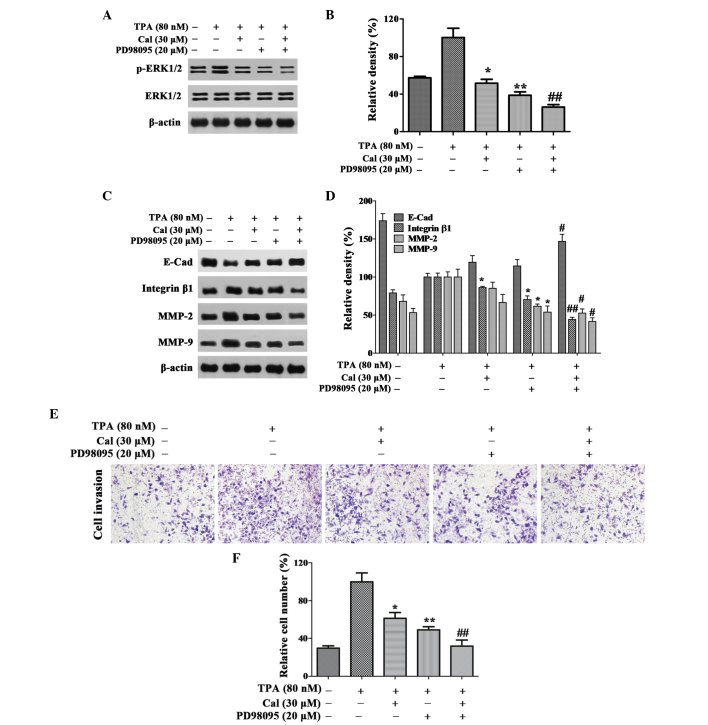
The migration and invasion of lung cancer cells into the extracellular matrix contributes to the high mortality rates of lung cancer. The protein kinase C (PKC) and downstream signaling pathways are important in the invasion and migration of lung cancer cells. Calycosin (Cal), an effector chemical from Astragalus has been reported to affect the recurrence and metastasis of cancer cells via the regulation of the protein expression of matrix metalloproteinases (MMPs). The inhibition of Cal on the migration and invasion of A549 cells was investigated in the present study. Cell viability and apoptosis assays were performed using MTT and flow cytometric analyses. A wound healing assay and Transwell invasion assay were performed to evaluate the effect of Cal on A549 cell migration and invasion. Invasion‑associated proteins, including MMP‑2, MMP‑9, E‑cadherin (E‑cad), integrin β1, PKC‑α and extracellular signal‑regulated kinase 1/2 (ERK1/2) were detected using western blotting. In addition, PKC‑α inhibitor, AEB071, and ERK1/2 inhibitor, PD98059, were used to determine the association between the suppression of PKC‑α /ERK1/2 and invasion, MMP‑2, MMP‑9, E‑cad and integrin β1. Cal was observed to suppress cell proliferation and induce apoptosis. There were significant differences between the phorbol‑12‑myristate‑13‑acetate (TPA)‑induced A549 cells treated with Cal and the untreated cells in the rates of migration and invasion. The levels of MMP‑2, MMP‑9, E‑cad and integrin β1 in the TPA‑induced A549 cells changed markedly, compared with the untreated cells. In addition, the suppression of Cal was affected by the PKC inhibitor, AEB071, an ERK1/2 inhibitor, PD98059. The results of the present study indicated that Cal inhibited the proliferation, adhesion, migration and invasion of the TPA‑induced A549 cells. The Cal‑induced repression of PKC‑α/ERK1/2, increased the expression of E‑Cad and inhibited the expression levels of MMP‑2, MMP‑9 and integrin β1, which possibly demonstrates the mechanism underlying the biological anticancer effects of Cal.
Figures
Similar articles
-
CT45A1 siRNA silencing suppresses the proliferation, metastasis and invasion of lung cancer cells by downregulating the ERK/CREB signaling pathway.Mol Med Rep. 2017 Nov;16(5):6708-6714. doi: 10.3892/mmr.2017.7466. Epub 2017 Sep 12. Mol Med Rep. 2017. PMID: 28901509 Free PMC article.
-
Transforming growth factor-beta1 induces tissue inhibitor of metalloproteinase-1 expression via activation of extracellular signal-regulated kinase and Sp1 in human fibrosarcoma cells.Mol Cancer Res. 2006 Mar;4(3):209-20. doi: 10.1158/1541-7786.MCR-05-0140. Mol Cancer Res. 2006. PMID: 16547158
-
Evodiamine inhibits the migration and invasion of nasopharyngeal carcinoma cells in vitro via repressing MMP-2 expression.Cancer Chemother Pharmacol. 2015 Dec;76(6):1173-84. doi: 10.1007/s00280-015-2902-9. Epub 2015 Nov 6. Cancer Chemother Pharmacol. 2015. PMID: 26546460
-
The complexities of PKCα signaling in cancer.Adv Biol Regul. 2021 May;80:100769. doi: 10.1016/j.jbior.2020.100769. Epub 2020 Nov 23. Adv Biol Regul. 2021. PMID: 33307285 Free PMC article. Review.
-
The potential role of formononetin in cancer treatment: An updated review.Biomed Pharmacother. 2023 Dec;168:115811. doi: 10.1016/j.biopha.2023.115811. Epub 2023 Nov 2. Biomed Pharmacother. 2023. PMID: 37922652 Review.
Cited by
-
Isoliensinine suppressed gastric cancer cell proliferation and migration by targeting TGFBR1 to regulate TGF-β-smad signaling pathways.Front Pharmacol. 2024 Sep 19;15:1438161. doi: 10.3389/fphar.2024.1438161. eCollection 2024. Front Pharmacol. 2024. PMID: 39364054 Free PMC article.
-
Unveiling the potential anti-cancer activity of calycosin against multivarious cancers with molecular insights: A promising frontier in cancer research.Cancer Med. 2024 Feb;13(3):e6924. doi: 10.1002/cam4.6924. Epub 2024 Jan 17. Cancer Med. 2024. PMID: 38230908 Free PMC article. Review.
-
Pharmacodynamic and pharmacokinetic assessment of pulmonary rehabilitation mixture for the treatment of pulmonary fibrosis.Sci Rep. 2017 Jun 14;7(1):3458. doi: 10.1038/s41598-017-02774-1. Sci Rep. 2017. PMID: 28615638 Free PMC article.
-
Cell Signaling Pathway in 12-O-Tetradecanoylphorbol-13-acetate-Induced LCN2 Gene Transcription in Esophageal Squamous Cell Carcinoma.Biomed Res Int. 2017;2017:9592501. doi: 10.1155/2017/9592501. Epub 2017 Oct 2. Biomed Res Int. 2017. PMID: 29098164 Free PMC article.
-
Protein Kinase C (PKC) Isozymes as Diagnostic and Prognostic Biomarkers and Therapeutic Targets for Cancer.Cancers (Basel). 2022 Nov 3;14(21):5425. doi: 10.3390/cancers14215425. Cancers (Basel). 2022. PMID: 36358843 Free PMC article. Review.
References
-
- Huo XW, Li SN, Shi TT, Suo AL, Ruan ZP, Yao Y. Tripartite motif 16 inhibits epithelial-mesenchymal transition and metastasis by downregulating sonic hedgehog pathway in non-small cell lung cancer cells. BBRC. 2015;460(1021) - PubMed
Publication types
MeSH terms
Substances
LinkOut - more resources
Full Text Sources
Other Literature Sources
Miscellaneous
