. 2015 Oct 24:15:232.
doi: 10.1186/s12866-015-0572-8.

Impact of efflux in the development of multidrug resistance phenotypes in Staphylococcus aureus

Affiliations

Impact of efflux in the development of multidrug resistance phenotypes in Staphylococcus aureus

Sofia Santos Costa et al. BMC Microbiol. .

Abstract

Background: Efflux has been recognized as a resistance mechanism to antimicrobials in Staphylococcus aureus; however its role on the development of clinically relevant resistance is still poorly characterized. This study aimed to examine the impact of efflux on development of resistance to fluoroquinolones and other antimicrobials in S. aureus strains representing relevant phenotypes in terms of antibiotic susceptibility and efflux activity.

Methods: Two closely related methicillin- and ciprofloxacin-resistant Staphylococcus aureus clinical strains, with different efflux capacity and the pan-susceptible strain ATCC25923 were exposed to constant concentrations of the efflux pump (EP) substrates ciprofloxacin, ethidium bromide and cetrimide. Parental and exposed strains were tested regarding their susceptibility towards antibiotics, biocides and ethidium bromide, efflux capacity and levels of EP gene expression. Occurrence of resistance-associated mutations was screened by sequencing.

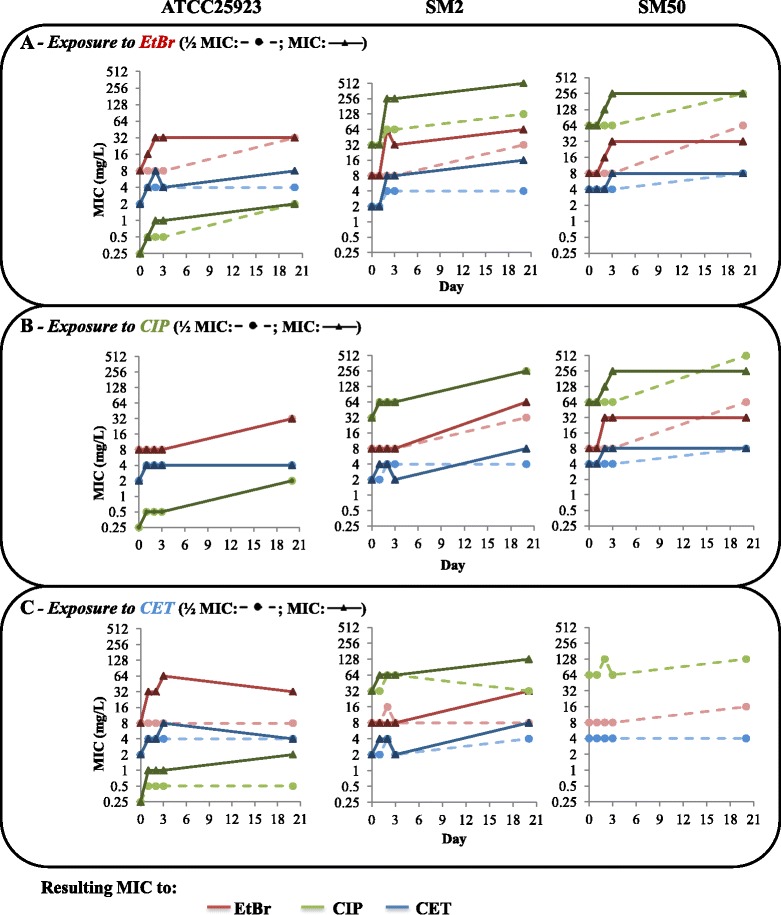
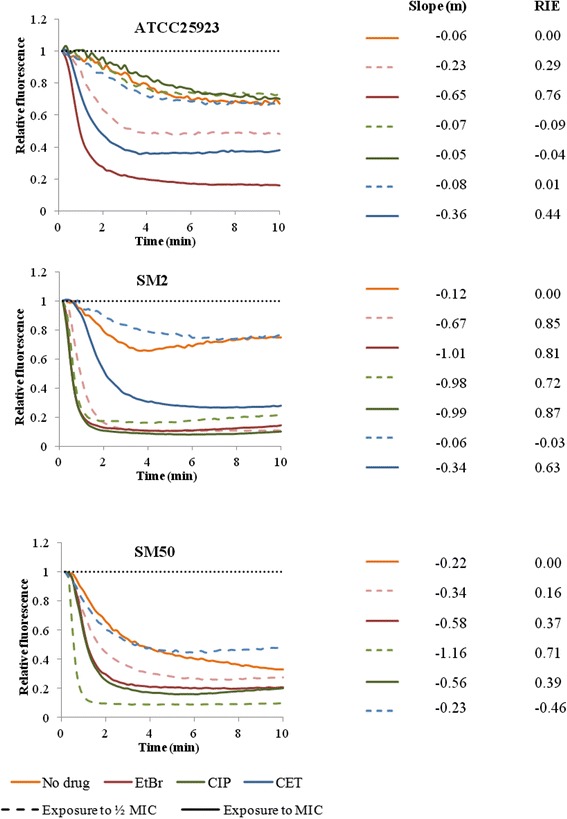
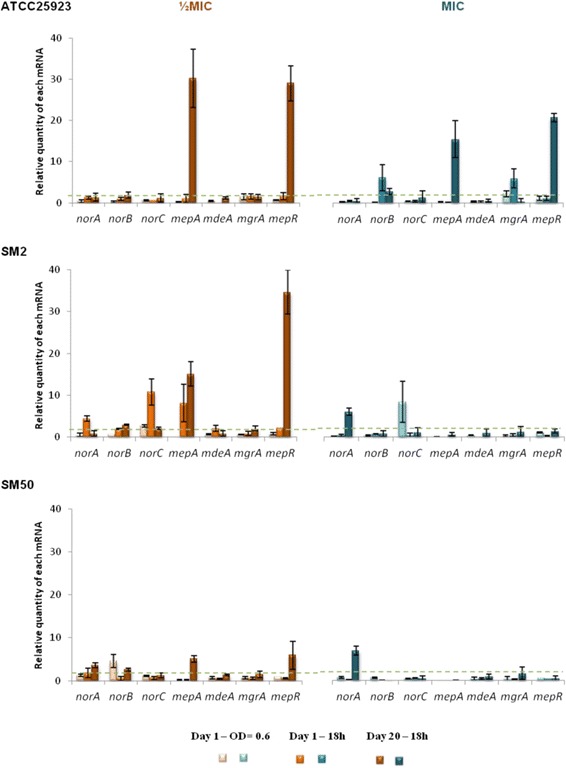
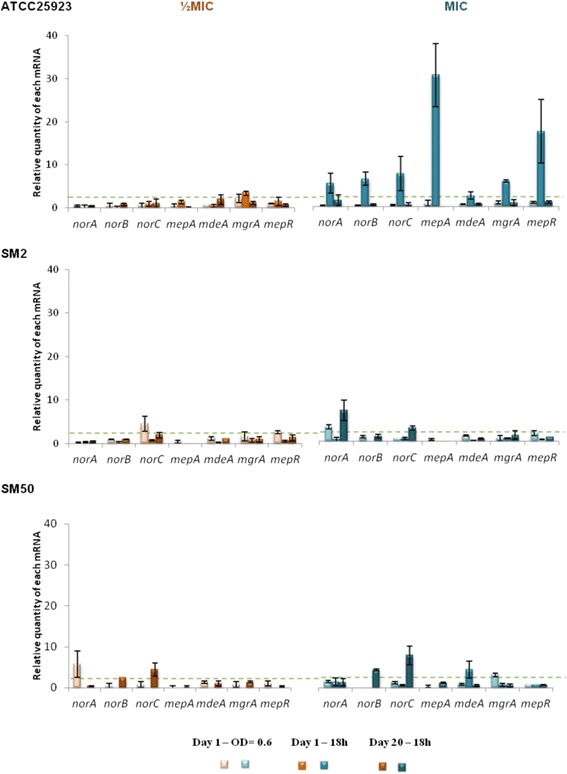
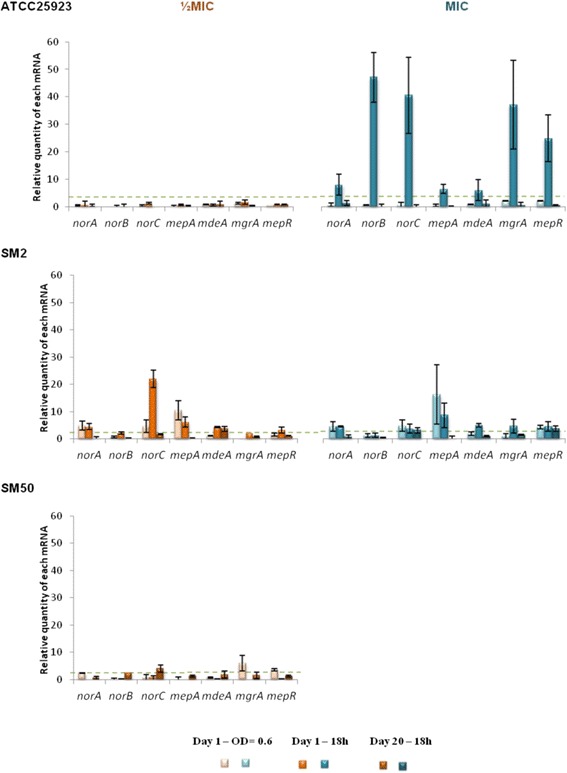
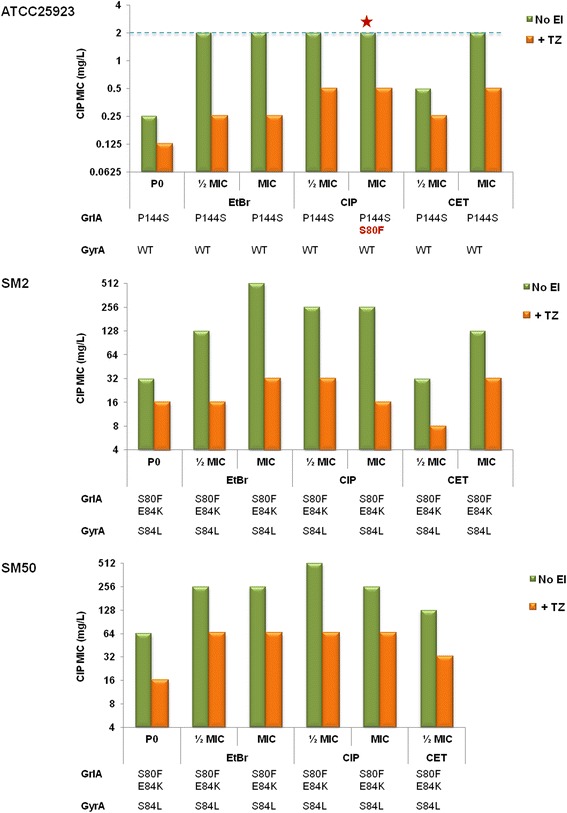
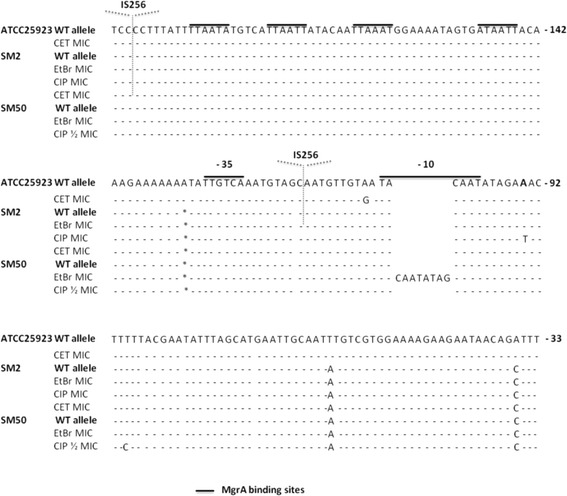
Results: Multidrug resistance phenotypes emerged upon exposure, independently of the substrate or its concentration, which were correlated with increased efflux capacity of the exposed strains. The temporal pattern of EP gene expression disclosed an early-response with high expression of several genes, followed by a late-response, characterized by overexpression of specific genes. The overall cell response was more pronounced for strains with an initial basal efflux activity. Remarkably, detection of the IS256 element in the promoter regions of mgrA and norA, in some cases associated with increased gene expression, suggests that these genes may be hot spots for IS256 insertion events. The results obtained with exposure of ATCC25923 to ciprofloxacin were particularly striking, revealing a step-wise development of fluoroquinolone resistance, with a first efflux-mediated response, followed by the occurrence of a mutation in grlA that resulted in phenotypic resistance. Additionally, challenge by non-fluoroquinolone agents, particularly cetrimide, promoted cross resistance to fluoroquinolones, revealing the potential role of biocides as selective pressure for the emergence of resistance to these antibiotics.

Conclusions: This study reveals efflux as a significant component of S. aureus resistance to fluoroquinolones and biocides and as a primary mechanism to withstand stress imposed by antimicrobials. This efflux-mediated response can result in the emergence of multidrug resistance in healthcare environments and should be taken into account in the management of this major pathogen.


Figures

Fig. 1
Fig. 1
Evolution of MIC values (mg/L) of the EP substrates for the strains in study. The data presented correspond to the MICs of ethidium bromide (EtBr, red), ciprofloxacin (CIP, green) and cetrimide (CET, blue) throughout the 20-day exposure to EtBr (a), CIP (b) and CET (c) at half MIC (dotted lines) or at the MIC (full lines) (data available for days 0, 1, 2, 3 and 20th). No growth was obtained for strain SM50 at the CET concentration corresponding to the MIC
Fig. 2
Fig. 2
Assessment of EtBr efflux for the strains in study. Efflux capacity was evaluated at the beginning (orange) and at the end of the exposure process to ethidium bromide (EtBr, red), ciprofloxacin (CIP, green) and cetrimide (CET, blue) at half MIC (dashed lines) and at the MIC (full lines). All assays were conducted in the presence of 0.4 % glucose. EtBr-loaded cells were obtained by incubation with 200 mg/L of VER plus the following EtBr concentrations: 0.125 mg/L (ATCC25923: P0, CIP(½MIC)_P20, CIP(MIC)_P20, CET(½MIC)_ P20; SM2: P0, CET(½MIC)_P20; SM50_CET(½MIC)_P20); 0.25 mg/L (ATCC25923: EtBr(½MIC)_P20, CET(MIC)_P20; SM2: CET(½MIC)_P20, CET(MIC)_P20; SM50: P0, EtBr(½MIC)_P20, EtBr(MIC)_P20, CIP(MIC)_P20); 0.5 mg/L (ATCC25923_EtBr(MIC)_P20; SM2: EtBr(½MIC)_P20, EtBr(MIC)_P20, CIP(MIC)_P20; SM50_CIP(½MIC)_P20). The data presented was normalized against the data obtained in conditions of no efflux (dotted line, cells incubated without glucose in the presence of 200 mg/L of VER). The slope (m) of the EtBr efflux curves was calculated by a linear regression of the values obtained in the first minutes of the assay and it relates to the rate of EtBr efflux in each condition tested. The Relative Index of Efflux activity (RIE) values were calculated as described in Methods and allow the direct comparison of the EtBr efflux activity of the strain after exposure (P20) to their initial efflux activity (P0)
Fig. 3
Fig. 3
Expression levels of EP and regulator genes of the strains in study during exposure to EtBr. Gene expression was measured in the presence of EtBr at half MIC (orange) and at the MIC (blue) relatively to the drug-free growth condition. The results are presented as the mean and standard deviation of at least two independent assays performed with total RNA. Overexpression was considered for values superior to 2 (cut-off value represented by the green dashed line)
Fig. 4
Fig. 4
Expression levels of EP and regulator genes of the strains in study during exposure to CIP. Gene expression was measured in the presence of CIP at half MIC (orange) and at the MIC (blue) relatively to the drug-free growth condition. The results are presented as the mean and standard deviation of at least two independent assays performed with extracted total RNA. Overexpression was considered for values superior to 2 (cut-off value represented by the green dashed line)
Fig. 5
Fig. 5
Expression levels of EP and regulator genes of the strains in study during exposure to CET. Gene expression was measured in the presence of CET at half MIC (orange) and at the MIC (blue) relatively to the drug-free growth condition. The results are presented as the mean and standard deviation of at least two independent assays performed with extracted total RNA. Overexpression was considered for values superior to 2 (cut-off value represented by the green dashed line)
Fig. 6
Fig. 6
Effect of thioridazine on the ciprofloxacin MIC for the strains exposed to EP substrates. MIC values were determined for each strain prior to exposure (P0) and after each exposure process (P20) in the absence (green columns) and in the presence (orange columns) of the efflux inhibitor thioridazine (TZ) at the sub-inhibitory concentration of 12.5 mg/L. The strain ATCC25923 exposed to the ciprofloxacin MIC was the single one in which a fluoroquinolone-resistance mutation (S80F in the QRDR region of GrlA) occurred during an exposure process (red star). The breakpoint for considering intermediate resistance to ciprofloxacin (according to CLSI guidelines) is represented by a blue dashed line
Fig. 7
Fig. 7
Location of the norA promoter mutations found in norA overexpressing strains following antimicrobial exposure. The nucleotides are numbered taking into consideration the norA starting codon. MgrA binding sites are identified by black lines. The consensus motifs −35 and −10 are also identified in black lines. The symbol * identifies the nucleotide −132 (A) which is absent in SM2 and SM50 norA promoter sequence. The sites of IS256 insertion within the norA promoter region of strain SM2 exposed to CET or EtBr MIC are also indicated (dotted arrows)

Similar articles

Cited by

References

    1. Chambers HF, DeLeo FR. Waves of resistance: Staphylococcus aureus in the antibiotic era. Nat Rev Microbiol. 2009;7:629–41. doi: 10.1038/nrmicro2200. - DOI - PMC - PubMed
    1. van Hal SJ, Jensen SO, Vaska VL, Espedido BA, Paterson DL, Gosbell IB. Predictors of mortality in Staphylococcus aureus bacteremia. Clin Microbiol Rev. 2012;25:362–86. doi: 10.1128/CMR.05022-11. - DOI - PMC - PubMed
    1. Gould IM, David MZ, Esposito S, Garau J, Lina G, Mazzei T, et al. New insights into meticillin-resistant Staphylococcus aureus (MRSA) pathogenesis, treatment and resistance. Int J Antimicrob Agents. 2012;39:96–104. doi: 10.1016/j.ijantimicag.2011.09.028. - DOI - PubMed
    1. Hooper DC. Mechanisms of fluoroquinolone resistance. Drug Resist Upd. 1999;2:38–55. doi: 10.1054/drup.1998.0068. - DOI - PubMed
    1. European Centre for Disease Prevention and Control (ECDC). Antimicrobial Resistance Surveillance in Europe 2013. Annual Report of the European Antimicrobial Resistance Surveillance Network (EARS-Net), ECDC: Stockholm, Sweden, 2014. Available: http://www.ecdc.europa.eu/en/publications/Publications/antimicrobial-res....

Publication types

MeSH terms

LinkOut - more resources