. 2015 Oct 26:5:15587.
doi: 10.1038/srep15587.

High-throughput genotyping of CRISPR/Cas9-mediated mutants using fluorescent PCR-capillary gel electrophoresis

Affiliations

High-throughput genotyping of CRISPR/Cas9-mediated mutants using fluorescent PCR-capillary gel electrophoresis

Muhammad Khairul Ramlee et al. Sci Rep. .

Abstract

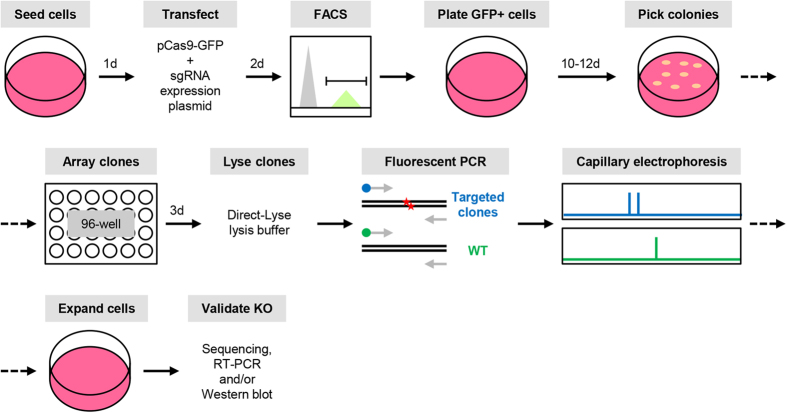
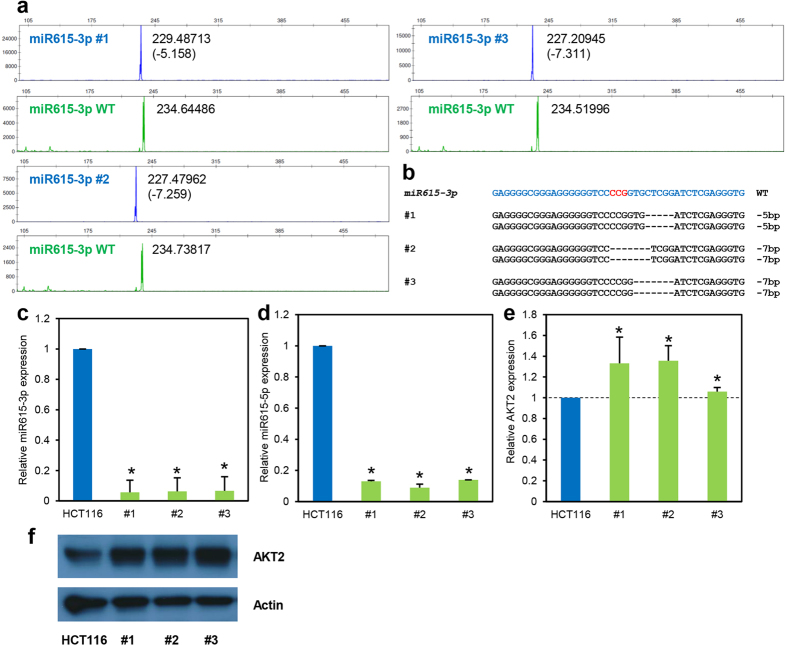
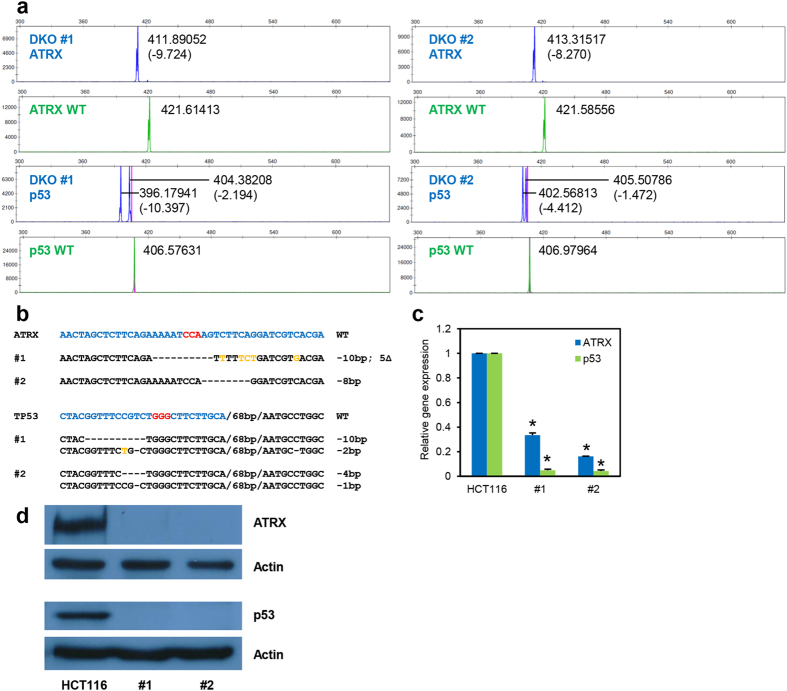
Recent advances in the engineering of sequence-specific synthetic nucleases provide enormous opportunities for genetic manipulation of gene expression in order to study their cellular function in vivo. However, current genotyping methods to detect these programmable nuclease-induced insertion/deletion (indel) mutations in targeted human cells are not compatible for high-throughput screening of knockout clones due to inherent limitations and high cost. Here, we describe an efficient method of genotyping clonal CRISPR/Cas9-mediated mutants in a high-throughput manner involving the use of a direct lysis buffer to extract crude genomic DNA straight from cells in culture, and fluorescent PCR coupled with capillary gel electrophoresis. This technique also allows for genotyping of multiplexed gene targeting in a single clone. Overall, this time- and cost-saving technique is able to circumvent the limitations of current genotyping methods and support high-throughput screening of nuclease-induced mutants.


Figures

Figure 1
Figure 1. Schematic of high-throughput genotyping technique via fluorescent PCR-capillary gel electrophoresis.
First, cells are transfected with plasmids expressing Cas9-GFP fusion protein and individual sgRNA. Two days later, GFP-positive cells are sorted and plated onto 10-cm dishes. When individual colonies of cells are visible, they are picked and arrayed on 96-well plates. When the arrayed cells reach ~80% confluence, they are lysed directly using Direct-Lyse buffer and the crude lysate is used to amplify the genomic region containing the expected indel site using fluorophore-labelled primers. The labelled amplicons are resolved via capillary gel electrophoresis and successful mutants are identified by shifts in fragment size with respect to wildtype fragment. Putative knock-out clones are expanded and validated via Sanger sequencing, quantitative RT-PCR and/or Western blot analysis.
Figure 2
Figure 2. SURVEYOR mutation detection assay to test for sgRNA targeting efficiency.
Specific regions of ATRX (a), TP53 (b) and MIR615 (c) genes were targeted using CRISPR/Cas9 system (top) and the efficiency of the sgRNA used were examined via SURVEYOR assay (bottom). Top: The exons/coding region of each gene are represented by blue boxes and are numbered accordingly. CRISPR/Cas9 target sequences are given in green (protospacer) and red (protospacer adjacent motif, PAM) and the corresponding name of the sgRNA are shown in bold. Middle: Grey arrows represent PCR primers used to amplify targeted regions. Red arrows indicate the expected cleavage site of each sgRNA target and the expected sizes of the cleavage product are given next to them. Bottom: SURVEYOR mutation detection assay results for each sgRNA tested. Red stars indicate the cleavage products of the samples indicated above each lane and the numbers at the bottom indicate estimated indel frequency. PC: positive control (G and C control from SURVEYOR assay kit); EV: empty vector (without sgRNA expression cassette).
Figure 3
Figure 3. Genotyping of ATRX-targeted clones via fluorescent PCR-capillary gel electrophoresis.
(a) HCT116 cells targeted with sgATRX-E4 were genotyped using fluorescent PCR-capillary gel electrophoresis and three representative clones are shown. Blue peaks indicate fragments obtained from PCR amplification of the region spanning the sgRNA target site in targeted cells using 6-FAM-labeled primers. Green peaks indicate similar fragments but from wildtype parental HCT116 cells and thus act as an internal size control. The numbers given in each plot represent the sizes of each peak (or fragment) and those in parentheses are the calculated difference in size (in base pairs) with respect to individual wildtype peaks. (b) Sanger sequencing results for the individual clones. Wildtype sequence is shown in blue and the PAM sequence in red. Inserted nucleotides are shown in green and underlined are the flanking nucleotides in the original sequence. Deleted nucleotides are shown as dashes (−). Quantitative RT-PCR (c) and Western blot (d) analyses were performed to corroborate knockout status of the clones shown. Error bars represent standard deviations of values from two independent experiments (n = 2). Asterisks represent significantly different (p < 0.05) expression levels as compared to the wildtype parental clone using one-tailed t-test.
Figure 4
Figure 4. Genotyping of TP53-targeted clones via fluorescent PCR-capillary gel electrophoresis.
TP53-targeted HCT116 cells were genotyped using fluorescent PCR-capillary gel electrophoresis (a) and several representative clones are shown. Clones #1 to #3 and clones #4 to #6 were targeted by sgTP53-E4.1 and –E4.2, respectively. (b) Sanger sequencing was performed to validate the indel mutations harboured by each clones. Representation of mutations is similar to that in Fig. 3b; in addition, orange nucleotides indicate substituted bases. Quantitative RT-PCR (c) and Western blot (d) analyses were performed to confirm the genotype of the clones. Error bars represent standard deviations of values from two independent experiments (n = 2). Asterisks represent significantly different (p < 0.05) expression levels as compared to the wildtype parental clone using one-tailed t-test.
Figure 5
Figure 5. Genotyping of MIR615-3p-targeted clones via fluorescent PCR-capillary gel electrophoresis.
MIR615 gene (specifically the region encoding miR615-3p) was targeted using CRISPR/Cas9 system in HCT116 cells. The genotype of individual targeted clones was determined via fluorescent PCR coupled with capillary gel electrophoresis (a) and verified using Sanger sequencing (b) and quantitative RT-PCR (c). (d) The expression of miR615-5p was evaluated using quantitative RT-PCR. In addition, the expression of a known target of miR615-3p, AKT2, was examined using quantitative RT-PCR (e) and Western blot analysis (f). All symbols and representations are identical to those in Fig. 3. Error bars represent standard deviations of values from two independent experiments (n = 2). Asterisks represent significantly different (p < 0.05) expression levels as compared to the wildtype parental clone using one-tailed t-test.
Figure 6
Figure 6. Genotyping of multiplex targeted clones via fluorescent PCR-capillary gel electrophoresis.
The genome of HCT116 cells was targeted using sgATRX-E4 and sgTP53-E4.2 and clones were genotyped via fluorescent PCR-capillary gel electrophoresis (a) at both loci (exon 4 of ATRX gene and exon 4 of TP53 gene). Two double knockout clones are shown. Sanger sequencing (b), quantitative RT-PCR (c) and Western blot (d) analyses were performed to validate the fluorescent PCR-capillary gel electrophoresis results and double knockout status of the two clones. All symbols and representations are identical to those in Figs 3 and 4. Error bars represent standard deviations of values from two independent experiments (n = 2). Asterisks represent significantly different (p < 0.05) expression levels as compared to the wildtype parental clone using one-tailed t-test.

References

    1. Perez E. E. et al.. Establishment of HIV-1 resistance in CD4+ T cells by genome editing using zinc-finger nucleases. Nat. Biotechnol. 26, 808–816 (2008). - PMC - PubMed
    1. Santiago Y. et al.. Targeted gene knockout in mammalian cells by using engineered zinc-finger nucleases. Proc. Natl. Acad. Sci. USA 105, 5809–5814 (2008). - PMC - PubMed
    1. Sung Y. H. et al.. Knockout mice created by TALEN-mediated gene targeting. Nat. Biotechnol. 31, 23–24 (2013). - PubMed
    1. Shalem O. et al.. Genome-scale CRISPR-Cas9 knockout screening in human cells. Science 343, 84–87 (2014). - PMC - PubMed
    1. Zhou Y. et al.. High-throughput screening of a CRISPR/Cas9 library for functional genomics in human cells. Nature 509, 487–491 (2014). - PubMed