

Simultaneous perturbation of the MAPK and the PI3K/mTOR pathways does not lead to increased radiosensitization
- PMID: 26498922
- PMCID: PMC4619315
- DOI: 10.1186/s13014-015-0514-5
Simultaneous perturbation of the MAPK and the PI3K/mTOR pathways does not lead to increased radiosensitization
Abstract
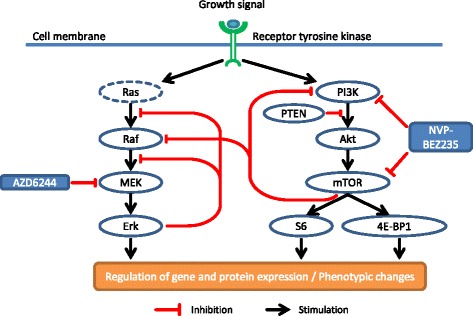
Background: The mitogen-activated protein kinases (MAPK) and the phosphatidylinositol-3-kinase (PI3K)/mammalian target of rapamycin (mTOR) pathways are intertwined on various levels and simultaneous inhibition reduces tumorsize and prolonges survival synergistically. Furthermore, inhibiting these pathways radiosensitized cancer cells in various studies. To assess, if phenotypic changes after perturbations of this signaling network depend on the genetic background, we integrated a time series of the signaling data with phenotypic data after simultaneous MAPK/ERK kinase (MEK) and PI3K/mTOR inhibition and ionizing radiation (IR).
Methods: The MEK inhibitor AZD6244 and the dual PI3K/mTOR inhibitor NVP-BEZ235 were tested in glioblastoma and lung carcinoma cells, which differ in their mutational status in the MAPK and the PI3K/mTOR pathways. Effects of AZD6244 and NVP-BEZ235 on the proliferation were assessed using an ATP assay. Drug treatment and IR effects on the signaling network were analyzed in a time-dependent manner along with measurements of phenotypic changes in the colony forming ability, apoptosis, autophagy or cell cycle.
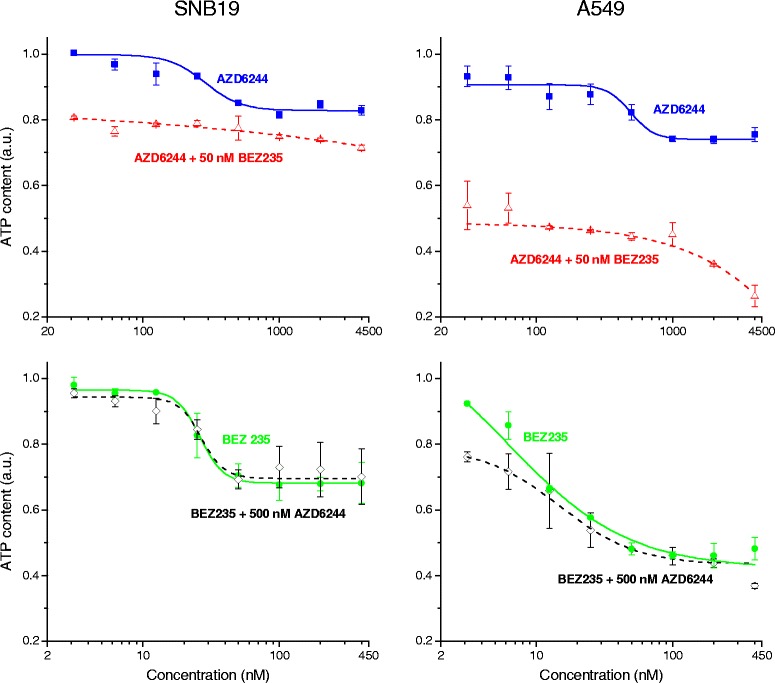
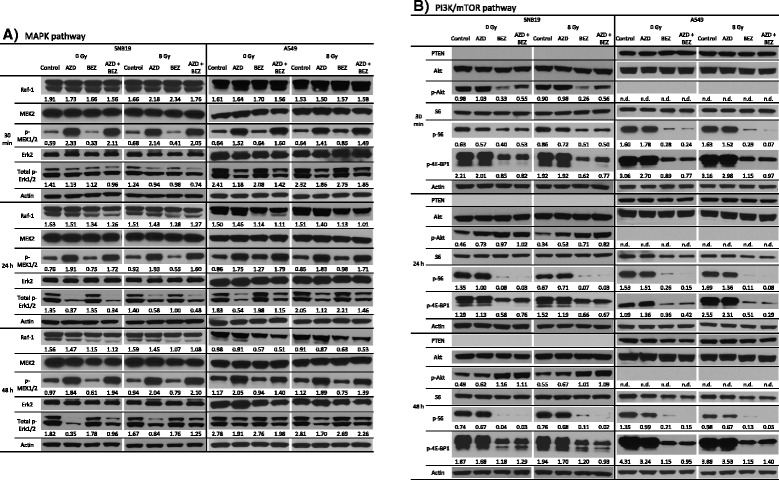
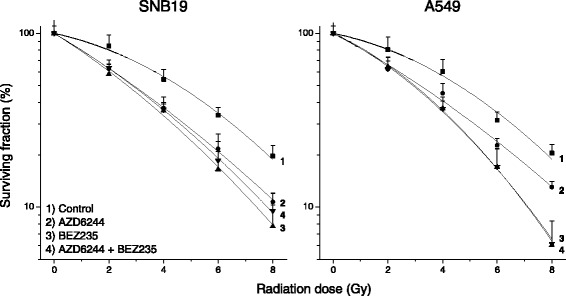
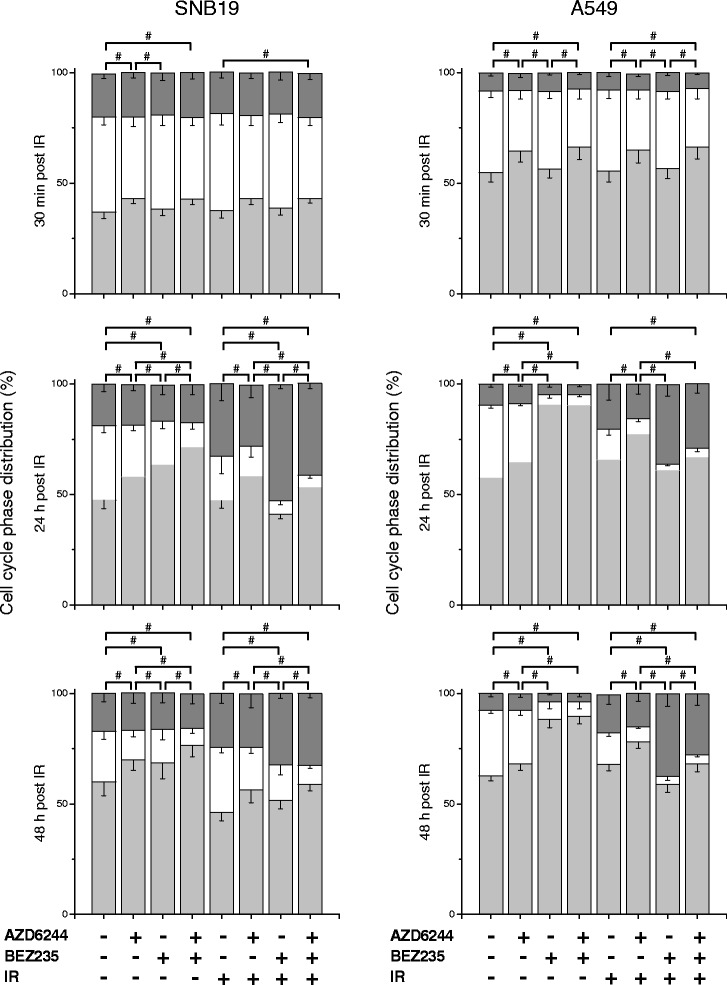
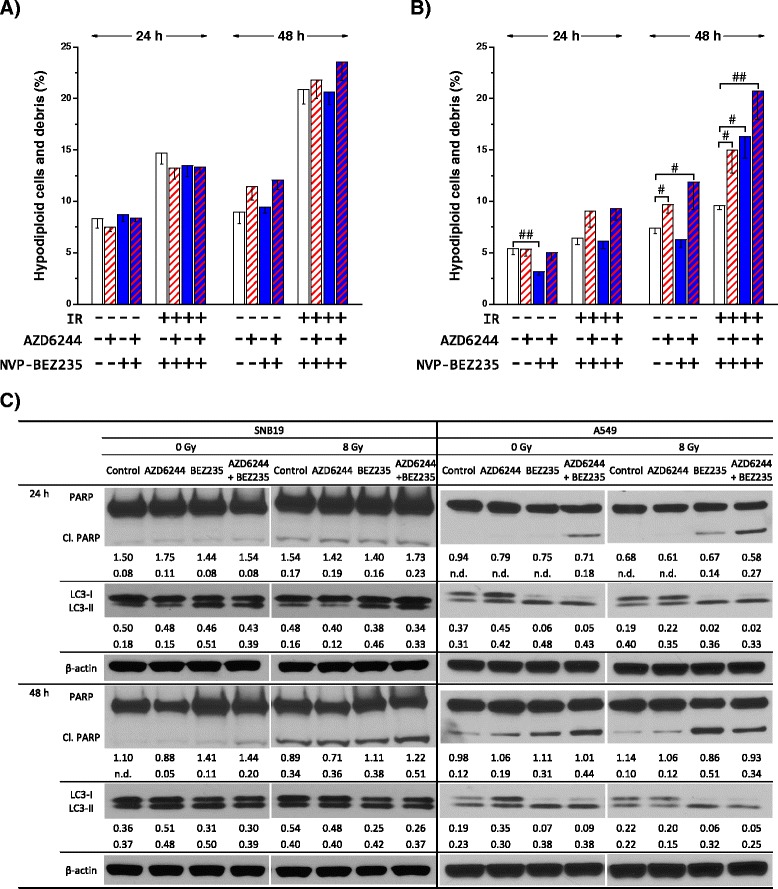
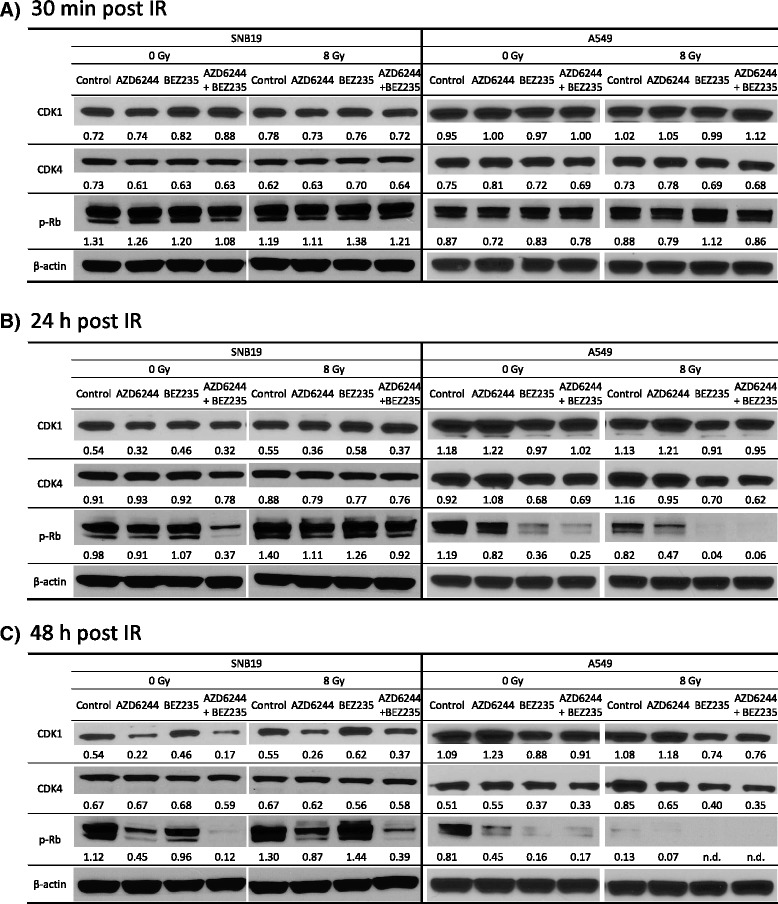
Results: Both inhibitors reduced the tumor cell proliferation in a dose-dependent manner, with NVP-BEZ235 revealing the higher anti-proliferative potential. Our Western blot data indicated that AZD6244 and NVP-BEZ235 perturbed the MAPK and PI3K/mTOR signaling cascades, respectively. Additionally, we confirmed crosstalks and feedback loops in the pathways. As shown by colony forming assay, the AZD6244 moderately radiosensitized cancer cells, whereas NVP-BEZ235 caused a stronger radiosensitization. Combining both drugs did not enhance the NVP-BEZ235-mediated radiosensitization. Both inhibitors caused a cell cycle arrest in the G1-phase, whereas concomitant IR and treatment with the inhibitors resulted in cell line- and drug-specific cell cycle alterations. Furthermore, combining both inhibitors synergistically enhanced a G1-phase arrest in sham-irradiated glioblastoma cells and induced apoptosis and autophagy in both cell lines.
Conclusion: Perturbations of the MEK and the PI3K pathway radiosensitized tumor cells of different origins and the combination of AZD6244 and NVP-BEZ235 yielded cytostatic effects in several tumor entities. However, this is the first study assessing, if the combination of both drugs also results in synergistic effects in terms of radiosensitivity. Our study demonstrates that simultaneous treatment with both pathway inhibitors does not lead to synergistic radiosensitization but causes cell line-specific effects.
Figures
Similar articles
-
Dual blockade of PI3K/AKT/mTOR (NVP-BEZ235) and Ras/Raf/MEK (AZD6244) pathways synergistically inhibit growth of primary endometrioid endometrial carcinoma cultures, whereas NVP-BEZ235 reduces tumor growth in the corresponding xenograft models.Gynecol Oncol. 2015 Jul;138(1):165-73. doi: 10.1016/j.ygyno.2015.04.028. Epub 2015 Apr 28. Gynecol Oncol. 2015. PMID: 25933683
-
Efficacy of the dual PI3K and mTOR inhibitor NVP-BEZ235 in combination with imatinib mesylate against chronic myelogenous leukemia cell lines.Drug Des Devel Ther. 2017 Apr 3;11:1115-1126. doi: 10.2147/DDDT.S132092. eCollection 2017. Drug Des Devel Ther. 2017. PMID: 28435223 Free PMC article.
-
Inhibition of autophagy as a strategy to augment radiosensitization by the dual phosphatidylinositol 3-kinase/mammalian target of rapamycin inhibitor NVP-BEZ235.Mol Pharmacol. 2012 Dec;82(6):1230-40. doi: 10.1124/mol.112.080408. Epub 2012 Sep 18. Mol Pharmacol. 2012. PMID: 22989521 Free PMC article.
-
Studies of NVP-BEZ235 in melanoma.Curr Cancer Drug Targets. 2013 Feb;13(2):165-74. doi: 10.2174/1568009611313020006. Curr Cancer Drug Targets. 2013. PMID: 23215722 Review.
-
The PI3K/AKT/mTOR signaling pathway inhibitors enhance radiosensitivity in cancer cell lines.Mol Biol Rep. 2021 Aug;48(8):1-14. doi: 10.1007/s11033-021-06607-3. Epub 2021 Aug 6. Mol Biol Rep. 2021. PMID: 34357550 Review.
Cited by
-
ATR kinase inhibitors NVP-BEZ235 and AZD6738 effectively penetrate the brain after systemic administration.Radiat Oncol. 2018 Apr 23;13(1):76. doi: 10.1186/s13014-018-1020-3. Radiat Oncol. 2018. PMID: 29685176 Free PMC article.
-
Improving the Efficacy of Tumor Radiosensitization Through Combined Molecular Targeting.Front Oncol. 2020 Aug 4;10:1260. doi: 10.3389/fonc.2020.01260. eCollection 2020. Front Oncol. 2020. PMID: 32903756 Free PMC article. Review.
-
Targeting the PI3K/AKT/mTOR and RAF/MEK/ERK pathways for cancer therapy.Mol Biomed. 2022 Dec 21;3(1):47. doi: 10.1186/s43556-022-00110-2. Mol Biomed. 2022. PMID: 36539659 Free PMC article. Review.
-
Blockage of Autophagy Rescues the Dual PI3K/mTOR Inhibitor BEZ235-induced Growth Inhibition of Colorectal Cancer Cells.Dev Reprod. 2016 Mar;20(1):1-10. doi: 10.12717/DR.2016.20.1.001. Dev Reprod. 2016. PMID: 27294206 Free PMC article.
-
Horizontal Combination of MEK and PI3K/mTOR Inhibition in BRAF Mutant Tumor Cells with or without Concomitant PI3K Pathway Mutations.Int J Mol Sci. 2020 Oct 16;21(20):7649. doi: 10.3390/ijms21207649. Int J Mol Sci. 2020. PMID: 33081092 Free PMC article.
References
Publication types
MeSH terms
Substances
LinkOut - more resources
Full Text Sources
Other Literature Sources
Research Materials
Miscellaneous
