

Lower core body temperature and greater body fat are components of a human thrifty phenotype
- PMID: 26499440
- PMCID: PMC6417875
- DOI: 10.1038/ijo.2015.229
Lower core body temperature and greater body fat are components of a human thrifty phenotype
Abstract
Background/objectives: In small studies, a thrifty human phenotype, defined by a greater 24-hour energy expenditure (EE) decrease with fasting, is associated with less weight loss during caloric restriction. In rodents, models of diet-induced obesity often have a phenotype including a reduced EE and decreased core body temperature. We assessed whether a thrifty human phenotype associates with differences in core body temperature or body composition.
Subjects/methods: Data for this cross-sectional analysis were obtained from 77 individuals participating in one of two normal physiology studies while housed on our clinical research unit. Twenty-four-hour EE using a whole-room indirect calorimeter and 24-h core body temperature were measured during 24 h each of fasting and 200% overfeeding with a diet consisting of 50% carbohydrates, 20% protein and 30% fat. Body composition was measured by dual X-ray absorptiometry. To account for the effects of body size on EE, changes in EE were expressed as a percentage change from 24-hour EE (%EE) during energy balance.
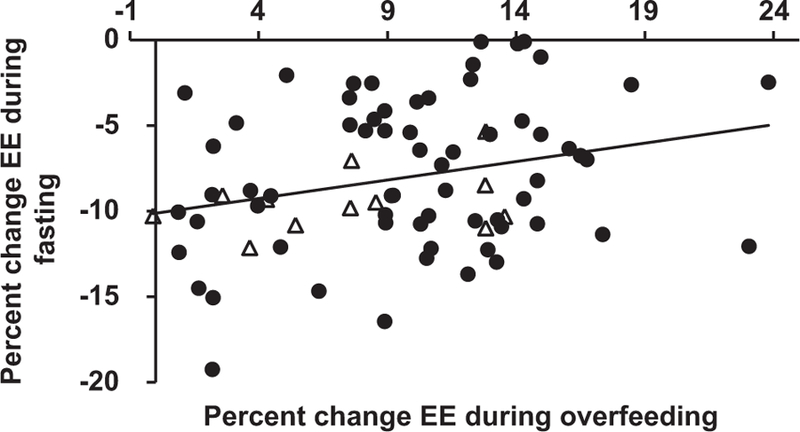
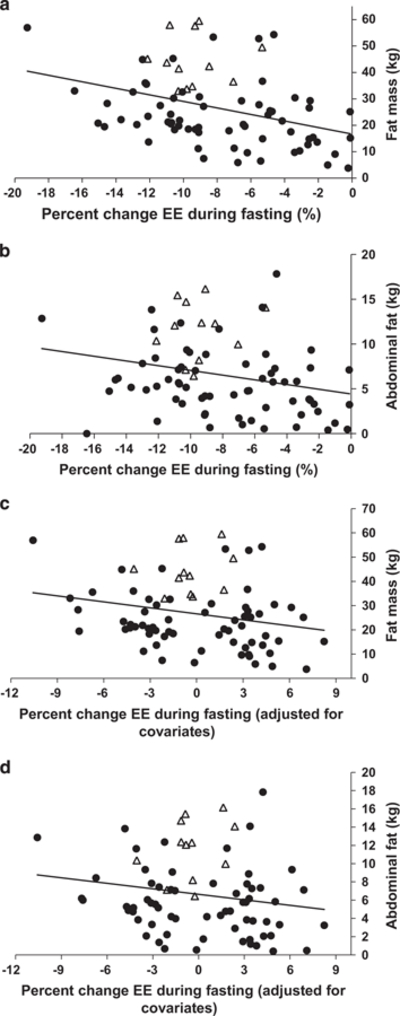
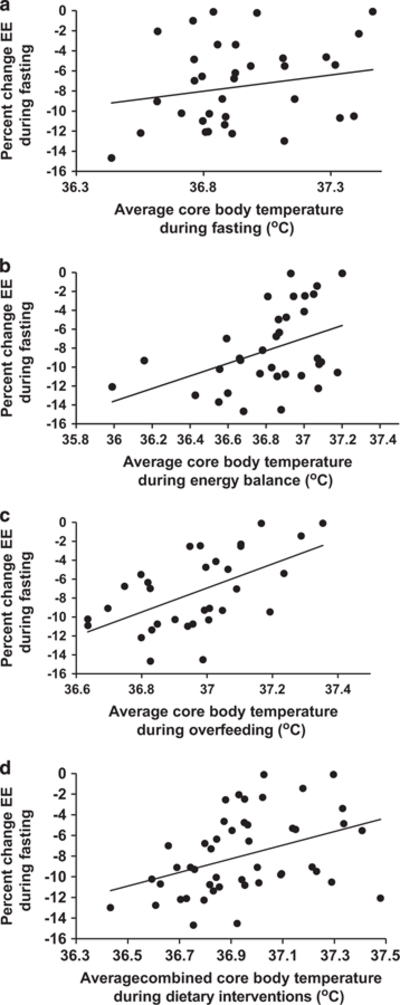
Results: A greater %EE decrease with fasting correlated with a smaller %EE increase with overfeeding (r=0.27, P=0.02). The %EE decrease with fasting was associated with both fat mass and abdominal fat mass, even after accounting for covariates (β=-0.16 (95% CI: -0.26, -0.06) %EE per kg fat mass, P=0.003; β=-0.0004 (-0.0007, -0.00004) %EE kg(-1) abdominal fat mass, P=0.03). In men, a greater %EE decrease in response to fasting was associated with a lower 24- h core body temperature, even after adjusting for covariates (β=1.43 (0.72, 2.15) %EE per 0.1 °C, P=0.0003).
Conclusions: Thrifty individuals, as defined by a larger EE decrease with fasting, were more likely to have greater overall and abdominal adiposity as well as lower core body temperature consistent with a more efficient metabolism.
Conflict of interest statement
CONFLICT OF INTEREST
The authors declare no conflict of interest.
Figures
References
-
- Weyer C, Vozarova B, Ravussin E, Tataranni PA. Changes in energy metabolism in response to 48 h of overfeeding and fasting in Caucasians and Pima Indians. Int J Obes Relat Metab Disord 2001; 25: 593–600. - PubMed
-
- Garrow JS, Warwick P, Blaza S, Ashwell M. Predisposition to obesity. Lancet 1980; 315: 1103–1104. - PubMed
-
- Miller DS, Mumford P, Stock MJ. Gluttony 2. Thermogenesis in Overeating Man. Am J Clin Nutr 1967; 20: 1223–1229. - PubMed
-
- Ravussin E, Schutz Y, Acheson KJ, Dusmet M, Bourquin L, Jéquier E. Short-term, mixed-diet overfeeding in man: no evidence for “luxuskonsumption”. Am J Physiol 1985; 249: E470–E477. - PubMed
Publication types
MeSH terms
Grants and funding
LinkOut - more resources
Full Text Sources
Other Literature Sources
Medical
