. 2016 Apr;40(4):675-84.
doi: 10.1038/ijo.2015.226. Epub 2015 Oct 26.

Surgical removal of inflamed epididymal white adipose tissue attenuates the development of non-alcoholic steatohepatitis in obesity

Affiliations

Surgical removal of inflamed epididymal white adipose tissue attenuates the development of non-alcoholic steatohepatitis in obesity

P Mulder et al. Int J Obes (Lond). 2016 Apr.

Abstract

Background: Non-alcoholic fatty liver disease (NAFLD) is strongly associated with abdominal obesity. Growing evidence suggests that inflammation in specific depots of white adipose tissue (WAT) has a key role in NAFLD progression, but experimental evidence for a causal role of WAT is lacking.

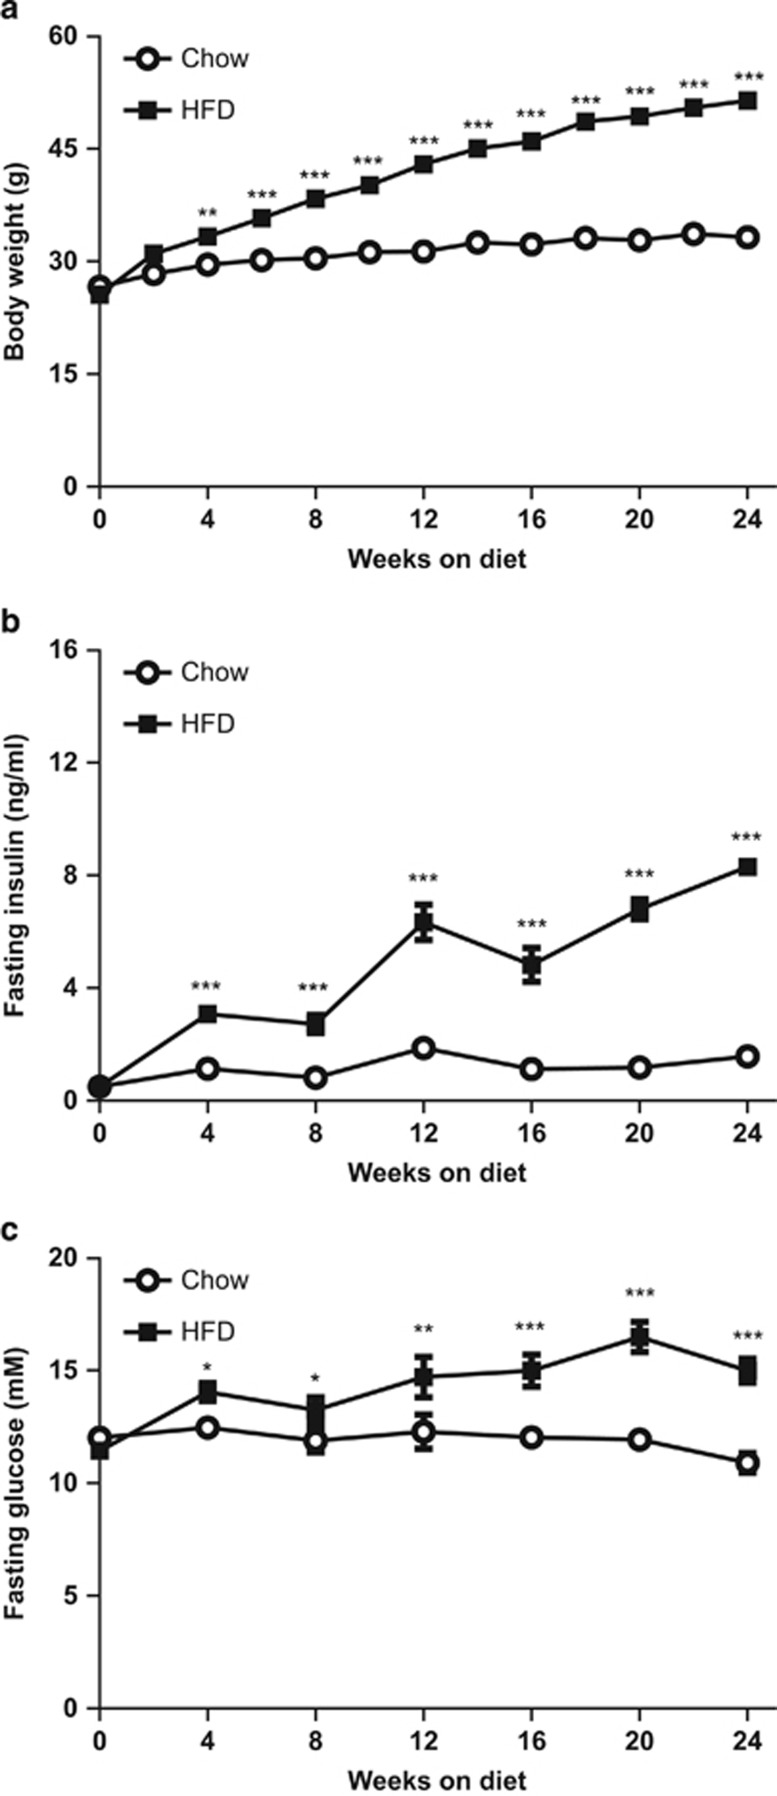
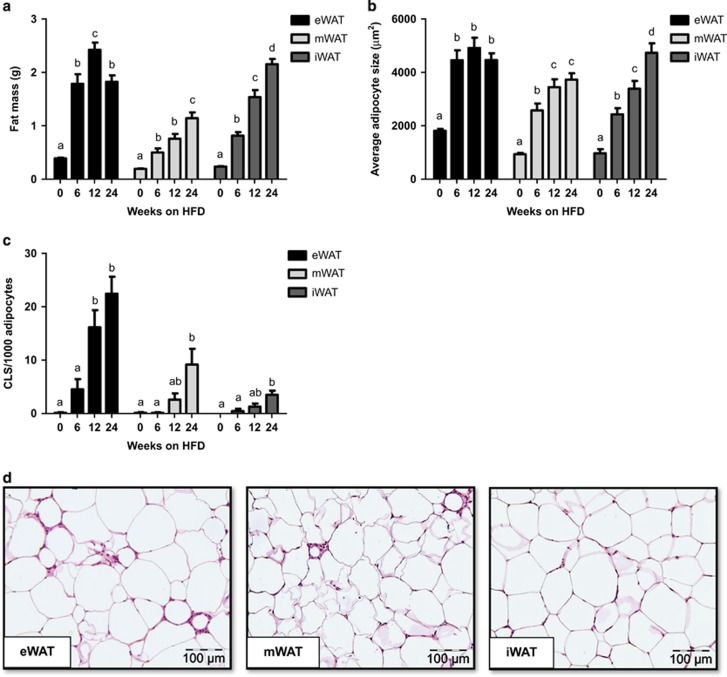
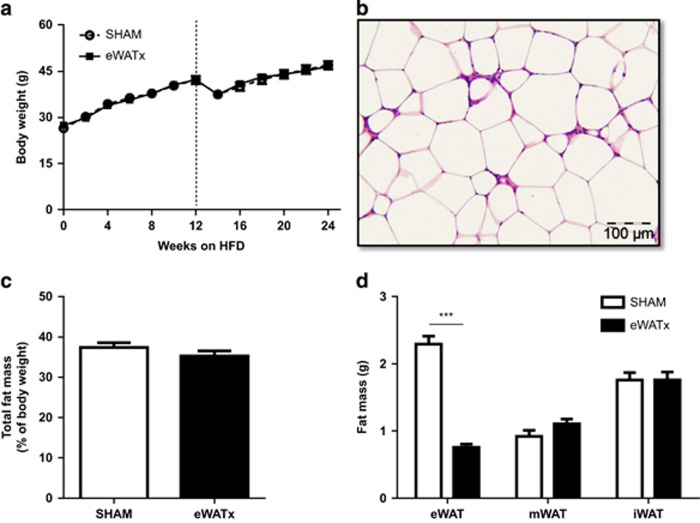
Methods: A time-course study in C57BL/6J mice was performed to establish which WAT depot is most susceptible to develop inflammation during high-fat diet (HFD)-induced obesity. Crown-like structures (CLS) were quantified in epididymal (eWAT), mesenteric (mWAT) and inguinal/subcutaneous (iWAT) WAT. The contribution of inflamed WAT to NAFLD progression was investigated by surgical removal of a selected WAT depot and compared with sham surgery. Plasma markers were analyzed by enzyme-linked immunosorbent assay (cytokines/adipokines) and lipidomics (lipids).

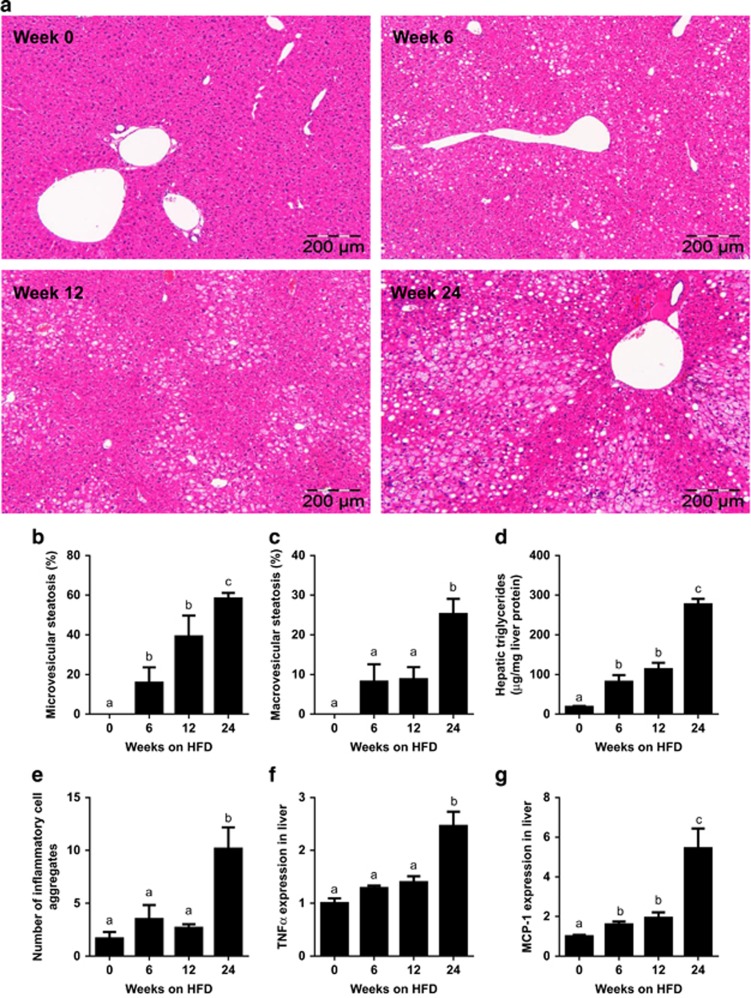
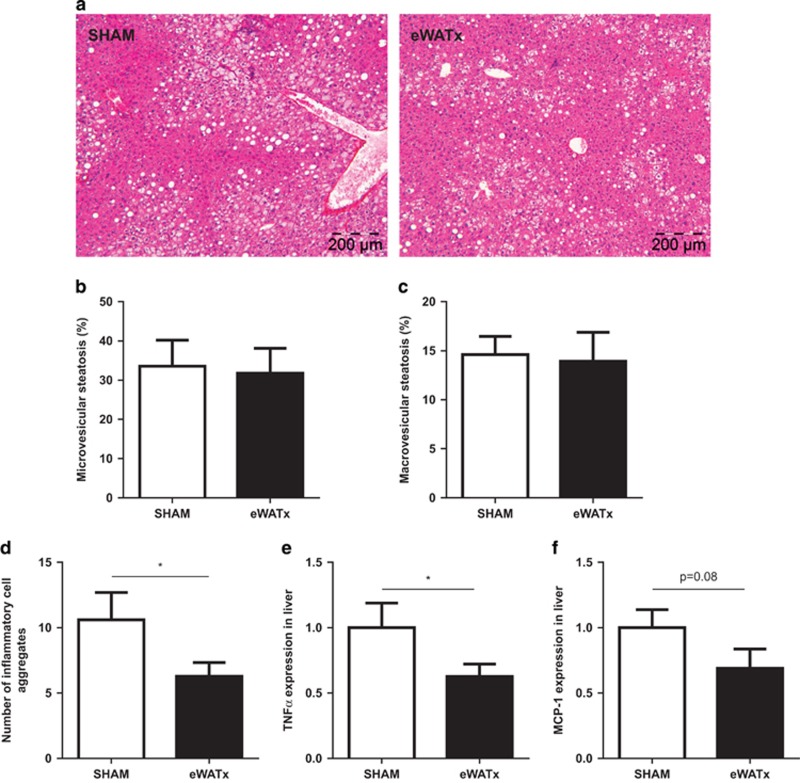
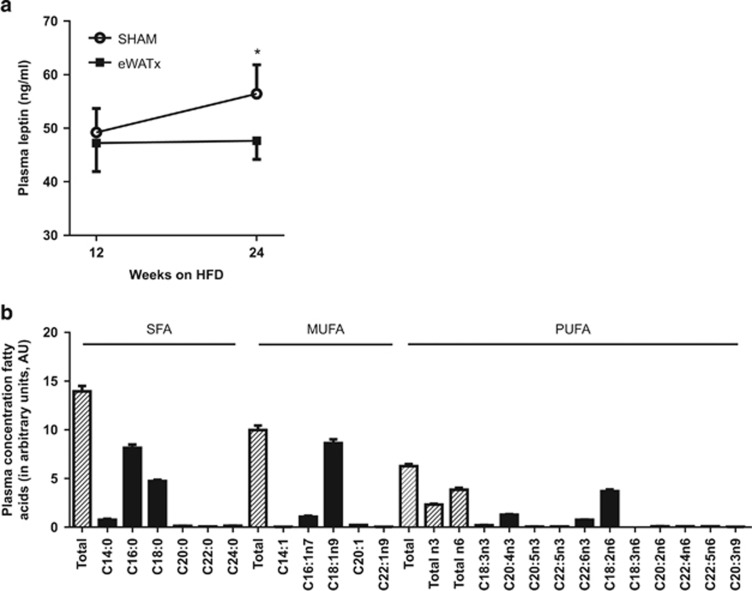
Results: In eWAT, CLS were formed already after 12 weeks of HFD, which coincided with maximal adipocyte size and fat depot mass, and preceded establishment of non-alcoholic steatohepatitis (NASH). By contrast, the number of CLS were low in mWAT and iWAT. Removal of inflamed eWAT after 12 weeks (eWATx group), followed by another 12 weeks of HFD feeding, resulted in significantly reduced NASH in eWATx. Inflammatory cell aggregates (-40%; P<0.05) and inflammatory genes (e.g., TNFα, -37%; P<0.05) were attenuated in livers of eWATx mice, whereas steatosis was not affected. Concomitantly, plasma concentrations of circulating proinflammatory mediators, viz. leptin and specific saturated and monounsaturated fatty acids, were also reduced in the eWATx group.

Conclusions: Intervention in NAFLD progression by removal of inflamed eWAT attenuates the development of NASH and reduces plasma levels of specific inflammatory mediators (cytokines and lipids). These data support the hypothesis that eWAT is causally involved in the pathogenesis of NASH.


Figures

Figure 1
Figure 1
Time-course analysis of the effect of HFD on body weight and metabolic parameters. (a) HFD feeding increased body weight compared with chow control diet. HFD feeding gradually increased fasting plasma concentrations of (b) insulin and (c) glucose compared with chow. Data are expressed as mean±s.e.m. (n=12 per group per time point), *P<0.05, **P<0.01, ***P<0.001 versus chow control.
Figure 2
Figure 2
Time-resolved development of NAFLD induced by HFD feeding. (a) Representative photomicrographs of Hematoxylin and Eosin-stained liver cross-sections of mice treated with HFD for 0, 6, 12 or 24 weeks (magnification × 100). Histological analysis of (b) microvesicular and (c) macrovesicular steatosis as percentage of the cross-sectional area (n=6–12 per group per time point). (d) Biochemical quantification of hepatic triglyceride content (n=11–12 per group). (e) Development of lobular inflammation in liver over time defined as the number of inflammatory cell aggregates (n=6–12 per group per time point). (f) Gene expression of TNFα and (g) MCP-1 in liver over time. Data (n=8 per group) are expressed as fold change in gene expression relative to t=0. Data are expressed as mean±s.e.m. a,b,cMean values with unlike letters differ significantly from each other (P<0.05).
Figure 3
Figure 3
Effect of HFD feeding on the quantity and inflammatory state of the eWAT, mWAT and iWAT depots. (a) WAT mass of eWAT, mWAT and iWAT depot during HFD feeding time-course experiment (n=12 per group per time point). (b) Development of adipocyte cell size of the different WAT depots quantified by morphometric analysis of Hematoxylin-Phloxine-Saffron (HPS)-stained sections. (c) Quantitative analysis of the number of crown-like structures (CLS) in the different WAT depots over time (n=8–12 per group per time point). (d) Representative images of HPS-stained cross-sections of eWAT, mWAT and iWAT after 24 weeks of HFD (magnification × 200). Data are expressed as mean±s.e.m. a,b,c,dMean values with unlike letters differ significantly from each other (P<0.05).
Figure 4
Figure 4
Effect of surgical removal of eWAT on body weight and other WAT depots. Mice were fed a HFD and, on average, 1.9 g of eWAT was carefully removed after 12 weeks of HFD. (a) Body weight development of the eWATx and SHAM group. The dashed line indicates the time point of surgery. (b) Representative image of a Hematoxylin-Phloxine-Saffron-stained eWAT cross-section showing presence of inflammatory cells and CLS at time of removal (magnification × 200). (c) Analysis of total fat mass measured by EchoMRI LLC in week 24 of HFD. (d) Mass of eWAT, mWAT and iWAT isolated at the end of the study (24 weeks of HFD) in eWATx and SHAM group. The eWAT mass of eWATx mice was significantly lower than in SHAM. Data also show that mWAT and iWAT did not compensate for the removed eWAT. Data are expressed as mean±s.e.m. (n=14–15 per group), ***P<0.001 versus SHAM.
Figure 5
Figure 5
Effect of surgical removal of eWAT on NAFLD development. (a) Representative images of Hematoxylin and Eosin-stained liver sections (magnification × 100). (b) Quantification of microvesicular steatosis and (c) macrovesicular steatosis as percentage of the cross-sectional liver area (n=14–15 per group). (d) Number of inflammatory cell aggregates in livers of eWATx and SHAM mice. Liver gene expression of (e) TNFα and (f) MCP-1 in eWATx and SHAM. Real-time PCR data are expressed as fold change in gene expression relative to SHAM (n=8 per group). Data are expressed as mean±s.e.m., *P<0.05.
Figure 6
Figure 6
Effect of surgical removal of eWAT on circulating inflammatory mediators and lipids. (a) Plasma concentrations of leptin before surgery at 12 weeks of HFD and at the end of the experiment (24 weeks) in eWATx and SHAM groups. Data are expressed as mean±s.e.m.,*P<0.05 according to paired Student's t-test. (b) Profiling of plasma lipids after 12 weeks of HFD by lipidomic analysis. Fasting plasma was collected before surgery. The levels of saturated free fatty acids (SFA), monounsaturated fatty acids (MUFA) and polyunsaturated fatty acids (PUFA) are shown and the most abundant lipid species of each category are indicated. Data are expressed as mean±s.e.m. and as arbitrary units (AU) relative to internal standard.

References

    1. Loomba R, Sanyal AJ. The global NAFLD epidemic. Nat Rev Gastroenterol Hepatol 2013; 10: 686–690. - PubMed
    1. de Alwis NM, Day CP. Non-alcoholic fatty liver disease: the mist gradually clears. J Hepatol 2008; 48: S104–S112. - PubMed
    1. Musso G, Gambino R, De Michieli F, Cassader M, Rizzetto M, Durazzo M et al. Dietary habits and their relations to insulin resistance and postprandial lipemia in nonalcoholic steatohepatitis. Hepatology 2003; 37: 909–916. - PubMed
    1. Tiniakos DG, Vos MB, Brunt EM. Nonalcoholic fatty liver disease: pathology and pathogenesis. Annu Rev Pathol 2010; 5: 145–171. - PubMed
    1. van der Poorten D, Milner KL, Hui J, Hodge A, Trenell MI, Kench JG et al. Visceral fat: a key mediator of steatohepatitis in metabolic liver disease. Hepatology 2008; 48: 449–457. - PubMed

Publication types