. 2016 Jan 15:125:456-478.
doi: 10.1016/j.neuroimage.2015.10.047. Epub 2015 Oct 21.

Regional growth and atlasing of the developing human brain

Affiliations

Regional growth and atlasing of the developing human brain

Antonios Makropoulos et al. Neuroimage. .

Abstract

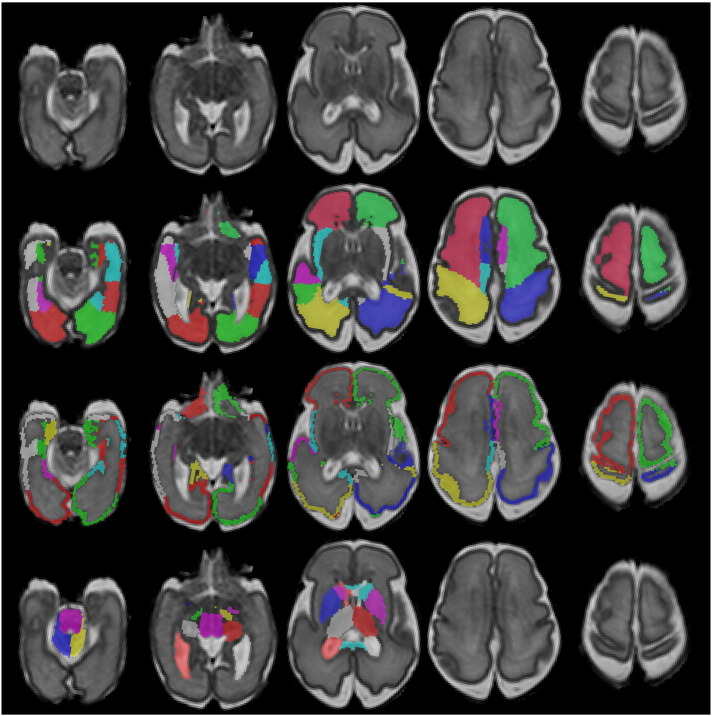
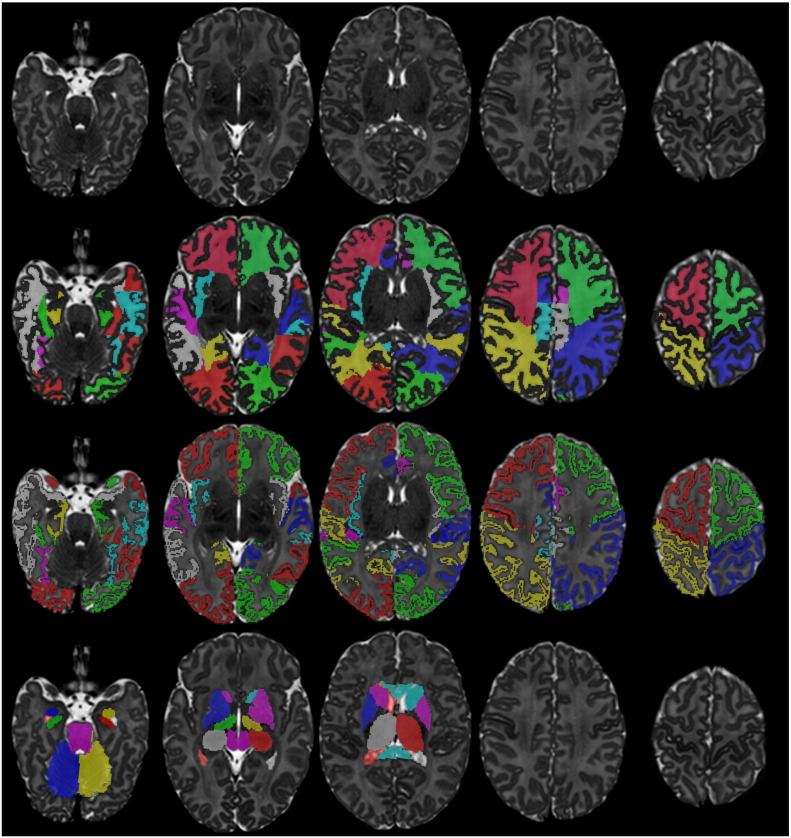
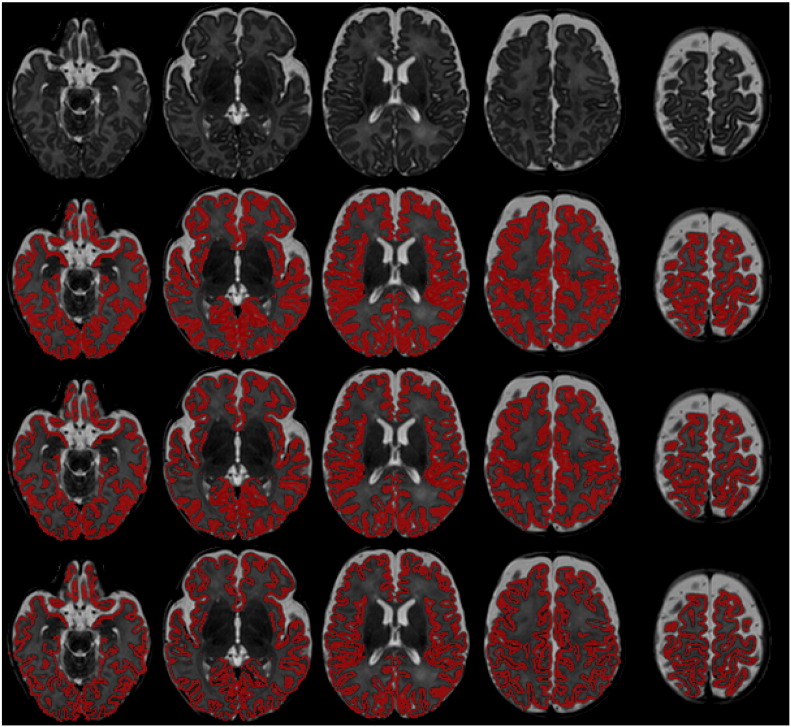
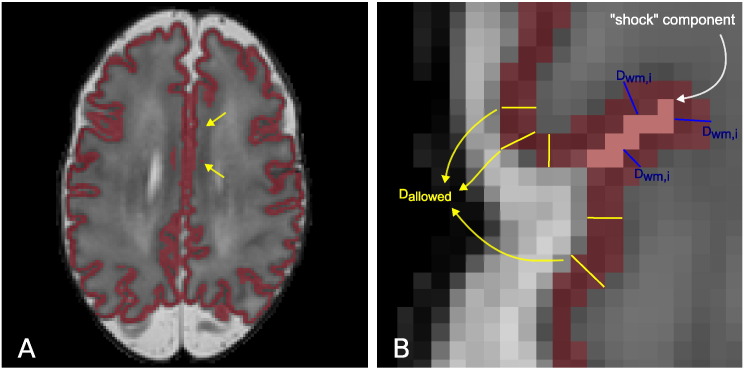
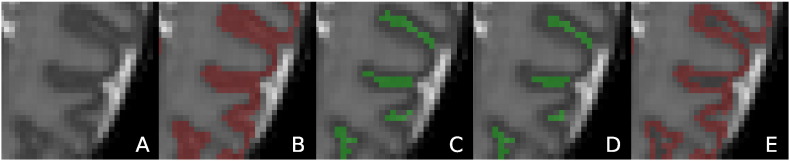
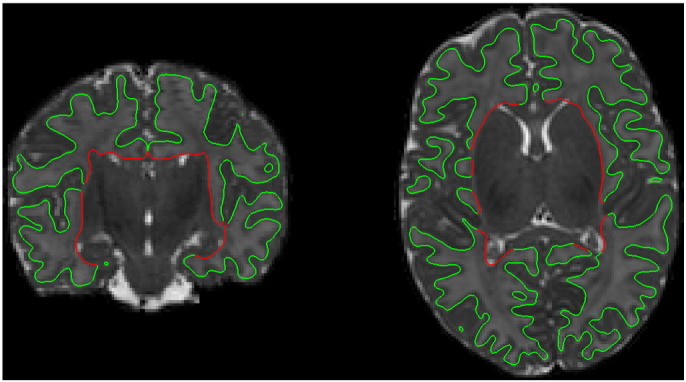
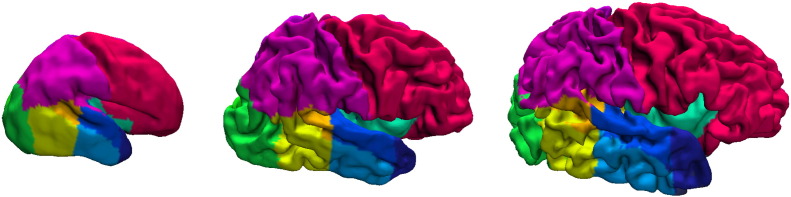
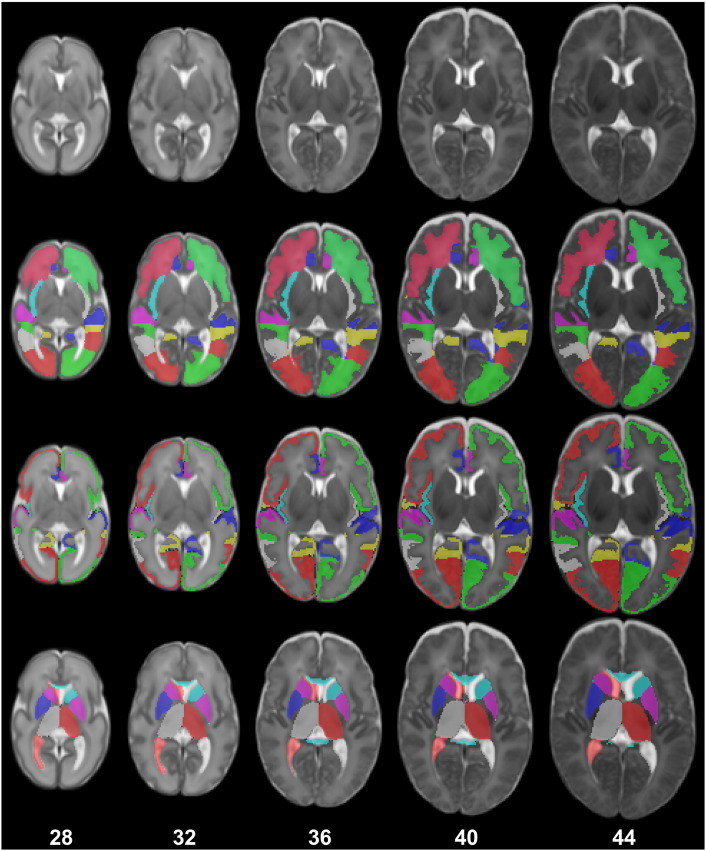
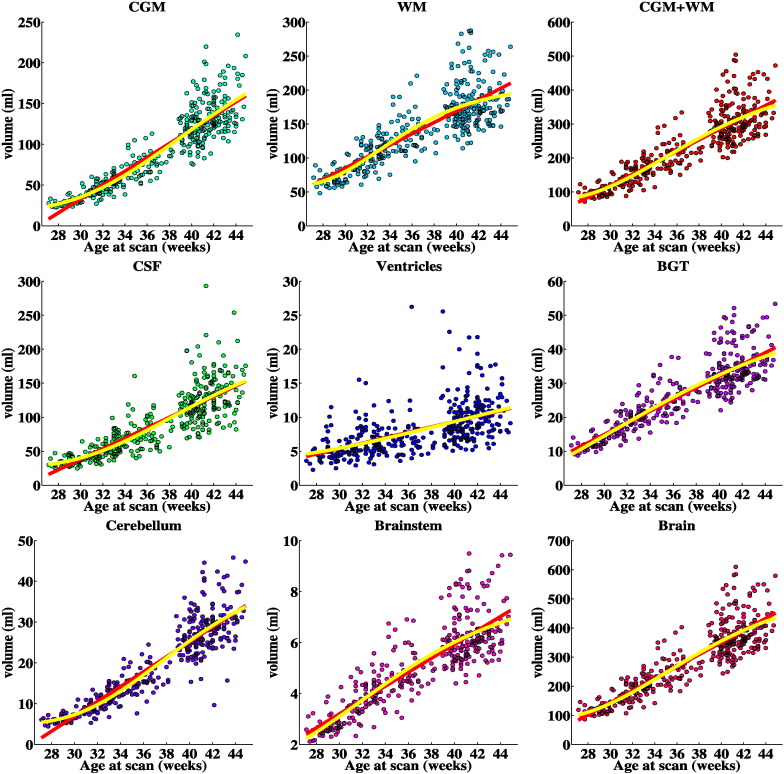
Detailed morphometric analysis of the neonatal brain is required to characterise brain development and define neuroimaging biomarkers related to impaired brain growth. Accurate automatic segmentation of neonatal brain MRI is a prerequisite to analyse large datasets. We have previously presented an accurate and robust automatic segmentation technique for parcellating the neonatal brain into multiple cortical and subcortical regions. In this study, we further extend our segmentation method to detect cortical sulci and provide a detailed delineation of the cortical ribbon. These detailed segmentations are used to build a 4-dimensional spatio-temporal structural atlas of the brain for 82 cortical and subcortical structures throughout this developmental period. We employ the algorithm to segment an extensive database of 420 MR images of the developing brain, from 27 to 45weeks post-menstrual age at imaging. Regional volumetric and cortical surface measurements are derived and used to investigate brain growth and development during this critical period and to assess the impact of immaturity at birth. Whole brain volume, the absolute volume of all structures studied, cortical curvature and cortical surface area increased with increasing age at scan. Relative volumes of cortical grey matter, cerebellum and cerebrospinal fluid increased with age at scan, while relative volumes of white matter, ventricles, brainstem and basal ganglia and thalami decreased. Preterm infants at term had smaller whole brain volumes, reduced regional white matter and cortical and subcortical grey matter volumes, and reduced cortical surface area compared with term born controls, while ventricular volume was greater in the preterm group. Increasing prematurity at birth was associated with a reduction in total and regional white matter, cortical and subcortical grey matter volume, an increase in ventricular volume, and reduced cortical surface area.


Figures

Fig. B.1
Fig. B.1
Volume(mL) centiles of tissues with increasing scan age. The yellow line for each region represents the 25% centile over the subjects in the database, the red line the median value, and the blue line the 75% centile.
Fig. B.2
Fig. B.2
Relative volume (ratio of structure's volume to the total brain volume) centiles of tissues with increasing scan age. The yellow line for each region represents the 25% centile over the subjects in the database, the red line the median value, and the blue line the 75% centile.
Fig. B.3
Fig. B.3
Volume(mL) centiles of the 82 structures of the whole brain with increasing scan age. The yellow line for each region represents the 25% centile over the subjects in the database, the red line the median value, and the blue line the 75% centile.
Fig. B.3
Fig. B.3
Volume(mL) centiles of the 82 structures of the whole brain with increasing scan age. The yellow line for each region represents the 25% centile over the subjects in the database, the red line the median value, and the blue line the 75% centile.
Fig. B.3
Fig. B.3
Volume(mL) centiles of the 82 structures of the whole brain with increasing scan age. The yellow line for each region represents the 25% centile over the subjects in the database, the red line the median value, and the blue line the 75% centile.
Fig. B.3
Fig. B.3
Volume(mL) centiles of the 82 structures of the whole brain with increasing scan age. The yellow line for each region represents the 25% centile over the subjects in the database, the red line the median value, and the blue line the 75% centile.
Fig. 1
Fig. 1
Example segmentation of a neonatal MRI acquired at 28 weeks PMA at scan with the 82 labels overlaid (second row: WM labels, third row: CGM labels, fourth row: subcortical GM labels and ventricles).
Fig. 2
Fig. 2
Example segmentation of a neonatal MRI acquired at 44 weeks PMA at scan with the 82 labels overlaid (second row: WM labels, third row: CGM labels, fourth row: subcortical GM labels and ventricles).
Fig. 3
Fig. 3
Example segmentations of a neonatal MRI acquired at 44 weeks PMA at scan (A). B presents the original segmentation with the standard Gaussian Mixture Model. C is obtained with the CGM–WM Partial Volume correction, reducing the CGM oversegmentation. D illustrates the final segmentation of the cortex after the sulci delineation.
Fig. 4
Fig. 4
Axial slice of a T2-weighted MRI (A) and magnified region of the cortex (B). Due to PV effects, the CSF inside the cortical sulci is often hard to discriminate, and consequently delineate with intensity-based segmentation techniques. Especially in areas where cortical gyri “touch” each other there is often very little evidence, in terms of intensity, of the CSF inside the sulcus.
Fig. 5
Fig. 5
A: T2 with the cortical segmentation overlaid. The arrows show parts of the cortical ribbon connected across the two hemispheres in the midsection of the brain. B: Example shock points (in pink) detected for the cortical segmentation (in red). Shock voxels are labelled as CSF if their distance DWM,i to the WM is larger than Dallowed. Dallowed is estimated from neighbouring parts of the cortical ribbon with streamlines that do not cross shock points (yellow lines).
Fig. 6
Fig. 6
Sulci detection and enhancement. The cortical segmentation of the MRI in A is presented in B and E before and after the sulci delineation. Shock voxels detected are illustrated in C. The voxels that are finally labelled as CSF (sulci enhancement) are shown in D.
Fig. 7
Fig. 7
Example cortical surface of a neonate at 44 weeks PMA at scan. The red part of the surface that corresponds to the WM – deep GM boundary is excluded from the cortical surface measurements.
Fig. 8
Fig. 8
Example cortical surfaces for neonates at 28, 36 and 44 weeks PMA at scan with the labels overlaid.
Fig. 9
Fig. 9
The maximum probability structural atlas shown at different ages. The structures of the atlas (second row: WM structures, third row: CGM structures, fourth row: subcortical GM structures and ventricles) are defined in the coordinate space of the spatio-temporal template of Serag et al. (2012) (first row).
Fig. 10
Fig. 10
The probabilistic structural atlas shown at different ages. The following probability maps are displayed (second-seventh row): WM (sum of the probability maps of the WM structures), right frontal lobe WM, CGM (sum of the probability maps of the CGM structures), right frontal lobe GM, subcortical GM and ventricles (sum of the probability maps of the subcortical GM structures and the ventricles), right thalamus. The probabilistic structural atlas is defined in the coordinate space of the spatio-temporal template of Serag et al. (2012) (first row).
Fig. 11
Fig. 11
Example of a positive Gompertz function (blue line) that models growth and a negative Gompertz function (red line) that models decline as a function of time t. The left plot displays the function f(t) and the right plot the gradient of the function df(t). The peak growth/decline occurs at time t = βt displayed with a dotted line.
Fig. 12
Fig. 12
Tissue volumes of the preterm infants with increasing PMA at scan. The red line represents the linear regression fit and the yellow line the Gompertz fit to the data.
Fig. 13
Fig. 13
Relative tissue volumes of the preterm infants with increasing PMA at scan (% of the total brain volume). The red line represents the linear regression fit and the yellow line the Gompertz fit to the data.
Fig. 14
Fig. 14
Cortical surface measurements of the preterm infants with increasing age at scan. The red line represents the linear regression fit and the yellow line the Gompertz fit to the data.
Fig. 15
Fig. 15
Relative WM and CGM volumes (left plot) and cortical thickness (centre and right plot) with increasing age at scan with and without the proposed CGM–WM partial volume correction and sulci correction. The left plot presents the volumetric results obtained by a Gaussian Mixture Model that assumes one class for WM and one class for CGM with dotted lines, and the results including the proposed corrections with continuous lines. The centre and right plot present the thickness results without and with the proposed corrections respectively. The red line in the thickness plots represents the linear regression fit and the yellow line the Gompertz fit to the data.

References

    1. Ajayi-Obe M., Saeed N., Cowan F.M., Rutherford M.A., Edwards A.D. Reduced development of cerebral cortex in extremely preterm infants. Lancet. 2000;356(9236):1162–1163. - PubMed
    1. Anbeek P., Vincken K.L., Groenendaal F., Koeman A., van Osch M.J.P., van der Grond J. Probabilistic brain tissue segmentation in neonatal magnetic resonance imaging. Pediatr. Res. 2008;63(2):158–163. - PubMed
    1. Ball G., Boardman J.P., Rueckert D., Aljabar P., Arichi T., Merchant N., Gousias I.S., Edwards A.D., Counsell S.J. The effect of preterm birth on thalamic and cortical development. Cereb. Cortex. 2012;22(5):1016–1024. - PMC - PubMed
    1. Bernal-Rusiel J.L., Reuter M., Greve D.N., Fischl B., Sabuncu M.R. Spatiotemporal linear mixed effects modeling for the mass-univariate analysis of longitudinal neuroimage data. NeuroImage. 2013;81 - PMC - PubMed
    1. Blencowe H., Cousens S., Oestergaard M.Z., Chou D., Moller A.-B., Narwal R., Adler A., Vera Garcia C., Rohde S., Say L., Lawn J.E. National, regional, and worldwide estimates of preterm birth rates in the year 2010 with time trends since 1990 for selected countries: a systematic analysis and implications. Lancet. 2012;379(9832):2162–2172. - PubMed

Publication types