

FOXP1 suppresses immune response signatures and MHC class II expression in activated B-cell-like diffuse large B-cell lymphomas
- PMID: 26500140
- PMCID: PMC4777777
- DOI: 10.1038/leu.2015.299
FOXP1 suppresses immune response signatures and MHC class II expression in activated B-cell-like diffuse large B-cell lymphomas
Abstract
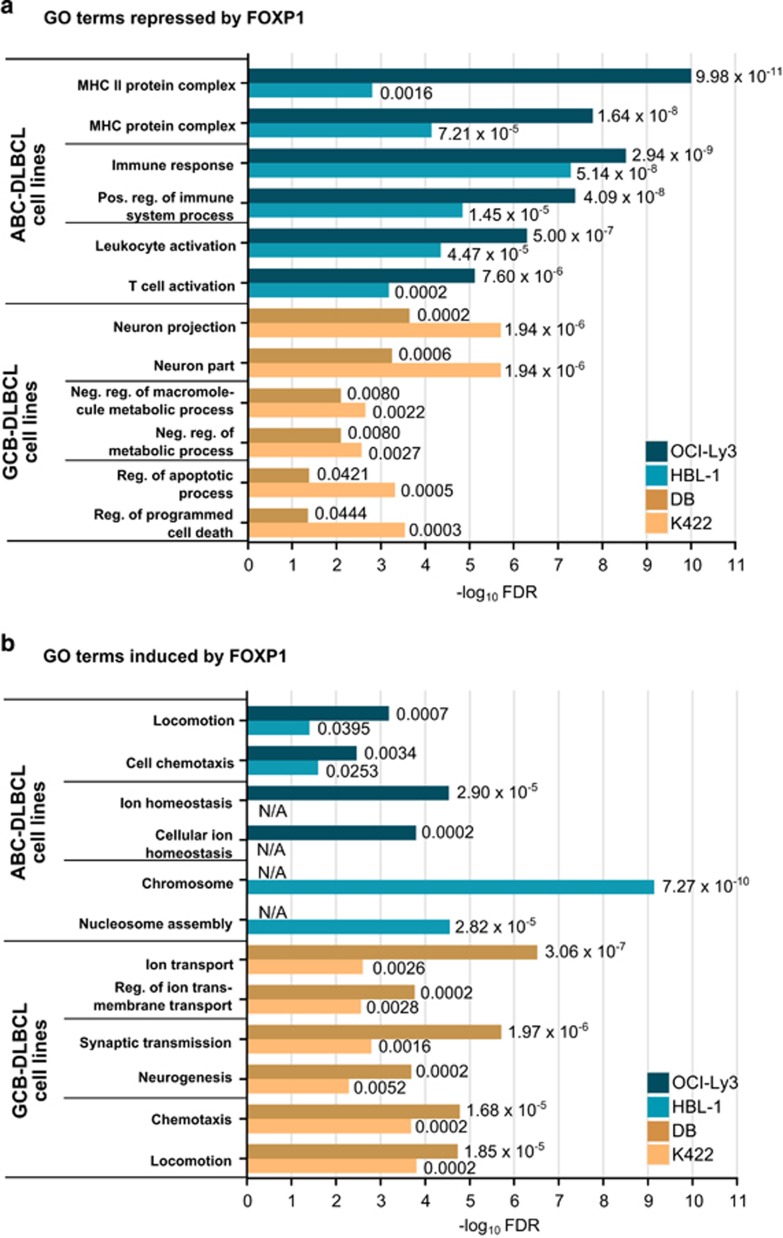
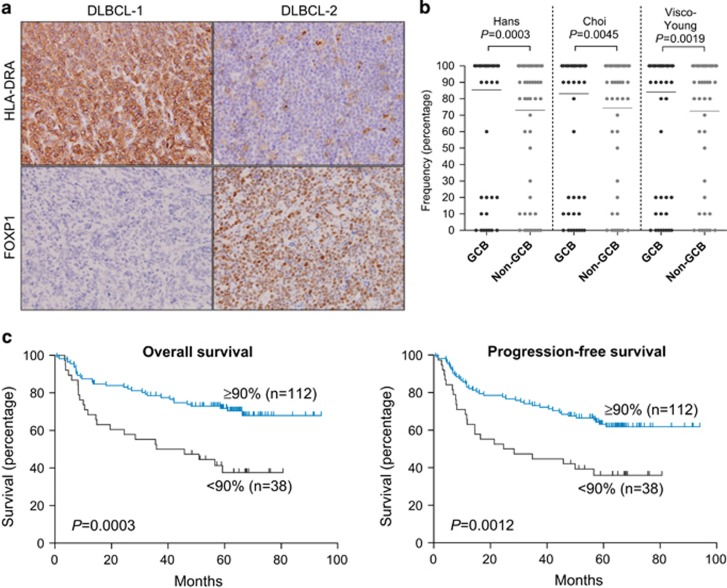
The FOXP1 (forkhead box P1) transcription factor is a marker of poor prognosis in diffuse large B-cell lymphoma (DLBCL). Here microarray analysis of FOXP1-silenced DLBCL cell lines identified differential regulation of immune response signatures and major histocompatibility complex class II (MHC II) genes as some of the most significant differences between germinal center B-cell (GCB)-like DLBCL with full-length FOXP1 protein expression versus activated B-cell (ABC)-like DLBCL expressing predominantly short FOXP1 isoforms. In an independent primary DLBCL microarray data set, multiple MHC II genes, including human leukocyte antigen DR alpha chain (HLA-DRA), were inversely correlated with FOXP1 transcript expression (P<0.05). FOXP1 knockdown in ABC-DLBCL cells led to increased cell-surface expression of HLA-DRA and CD74. In R-CHOP (rituximab, cyclophosphamide, doxorubicin, vincristine and prednisone)-treated DLBCL patients (n=150), reduced HLA-DRA (<90% frequency) expression correlated with inferior overall survival (P=0.0003) and progression-free survival (P=0.0012) and with non-GCB subtype stratified by the Hans, Choi or Visco-Young algorithms (all P<0.01). In non-GCB DLBCL cases with <90% HLA-DRA, there was an inverse correlation with the frequency (P=0.0456) and intensity (P=0.0349) of FOXP1 expression. We propose that FOXP1 represents a novel regulator of genes targeted by the class II MHC transactivator CIITA (MHC II and CD74) and therapeutically targeting the FOXP1 pathway may improve antigen presentation and immune surveillance in high-risk DLBCL patients.
Figures


Similar articles
-
Reciprocal expression of the endocytic protein HIP1R and its repressor FOXP1 predicts outcome in R-CHOP-treated diffuse large B-cell lymphoma patients.Leukemia. 2014 Feb;28(2):362-72. doi: 10.1038/leu.2013.224. Epub 2013 Jul 25. Leukemia. 2014. PMID: 23884370
-
FOXP2-positive diffuse large B-cell lymphomas exhibit a poor response to R-CHOP therapy and distinct biological signatures.Oncotarget. 2016 Aug 16;7(33):52940-52956. doi: 10.18632/oncotarget.9507. Oncotarget. 2016. PMID: 27224915 Free PMC article.
-
Cell-of-origin of diffuse large B-cell lymphomas determined by the Lymph2Cx assay: better prognostic indicator than Hans algorithm.Oncotarget. 2017 Mar 28;8(13):22014-22022. doi: 10.18632/oncotarget.15782. Oncotarget. 2017. PMID: 28423544 Free PMC article.
-
The significance of FOXP1 in diffuse large B-cell lymphoma.Leuk Lymphoma. 2017 May;58(5):1037-1051. doi: 10.1080/10428194.2016.1228932. Epub 2016 Sep 27. Leuk Lymphoma. 2017. PMID: 27678023 Review.
-
Treatment of Diffuse Large B-Cell Lymphoma.J Clin Exp Hematop. 2016;56(2):79-88. doi: 10.3960/jslrt.56.79. J Clin Exp Hematop. 2016. PMID: 27980306 Free PMC article. Review.
Cited by
-
Expression profile analysis identifies key genes as prognostic markers for metastasis of osteosarcoma.Cancer Cell Int. 2020 Mar 30;20:104. doi: 10.1186/s12935-020-01179-x. eCollection 2020. Cancer Cell Int. 2020. PMID: 32256213 Free PMC article.
-
FOXP1 expression is a prognostic biomarker in follicular lymphoma treated with rituximab and chemotherapy.Blood. 2018 Jan 11;131(2):226-235. doi: 10.1182/blood-2017-08-799080. Epub 2017 Nov 9. Blood. 2018. PMID: 29122756 Free PMC article. Clinical Trial.
-
Molecular High-Grade B-Cell Lymphoma: Defining a Poor-Risk Group That Requires Different Approaches to Therapy.J Clin Oncol. 2019 Jan 20;37(3):202-212. doi: 10.1200/JCO.18.01314. Epub 2018 Dec 3. J Clin Oncol. 2019. PMID: 30523719 Free PMC article.
-
Hide or defend, the two strategies of lymphoma immune evasion: potential implications for immunotherapy.Haematologica. 2018 Aug;103(8):1256-1268. doi: 10.3324/haematol.2017.184192. Epub 2018 Jul 13. Haematologica. 2018. PMID: 30006449 Free PMC article. Review.
-
The small FOXP1 isoform predominantly expressed in activated B cell-like diffuse large B-cell lymphoma and full-length FOXP1 exert similar oncogenic and transcriptional activity in human B cells.Haematologica. 2017 Mar;102(3):573-583. doi: 10.3324/haematol.2016.156455. Epub 2016 Dec 1. Haematologica. 2017. PMID: 27909217 Free PMC article.
References
-
- Alizadeh AA, Eisen MB, Davis RE, Ma C, Lossos IS, Rosenwald A et al. Distinct types of diffuse large B-cell lymphoma identified by gene expression profiling. Nature 2000; 403: 503–511. - PubMed
-
- Rosenwald A, Wright G, Chan WC, Connors JM, Campo E, Fisher RI et al. The use of molecular profiling to predict survival after chemotherapy for diffuse large-B-cell lymphoma. N Engl J Med 2002; 346: 1937–1947. - PubMed
-
- Banham AH, Beasley N, Campo E, Fernandez PL, Fidler C, Gatter K et al. The FOXP1 winged helix transcription factor is a novel candidate tumor suppressor gene on chromosome 3p. Cancer Res 2001; 61: 8820–8829. - PubMed
-
- Hu H, Wang B, Borde M, Nardone J, Maika S, Allred L et al. Foxp1 is an essential transcriptional regulator of B cell development. Nat Immunol 2006; 7: 819–826. - PubMed
Publication types
MeSH terms
Substances
LinkOut - more resources
Full Text Sources
Other Literature Sources
Molecular Biology Databases
Research Materials
