

Estimating Relatedness in the Presence of Null Alleles
- PMID: 26500259
- PMCID: PMC4701088
- DOI: 10.1534/genetics.114.163956
Estimating Relatedness in the Presence of Null Alleles
Abstract
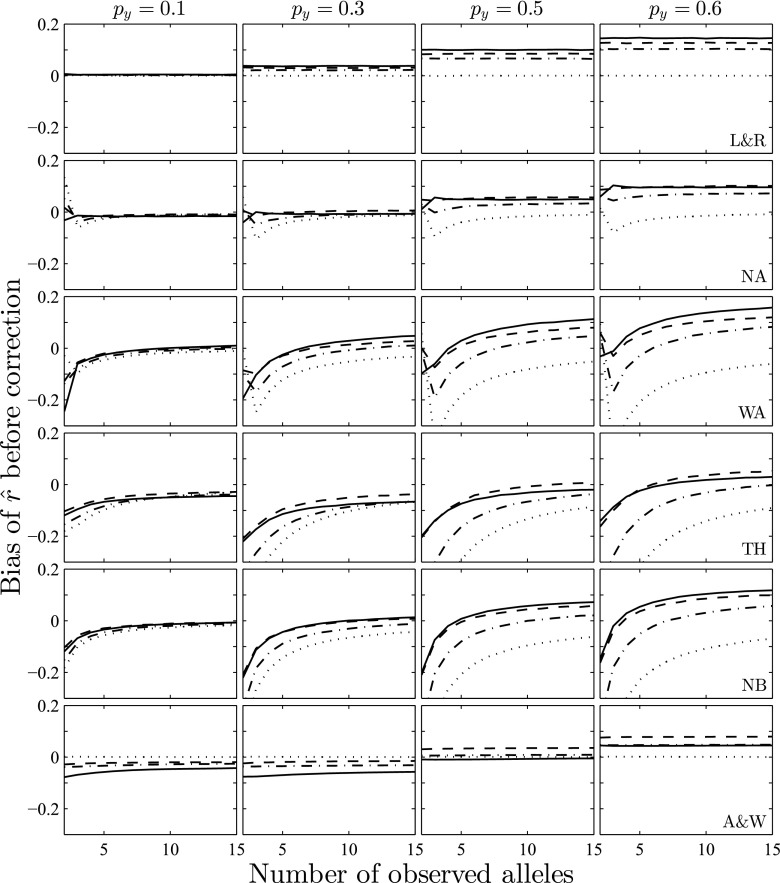
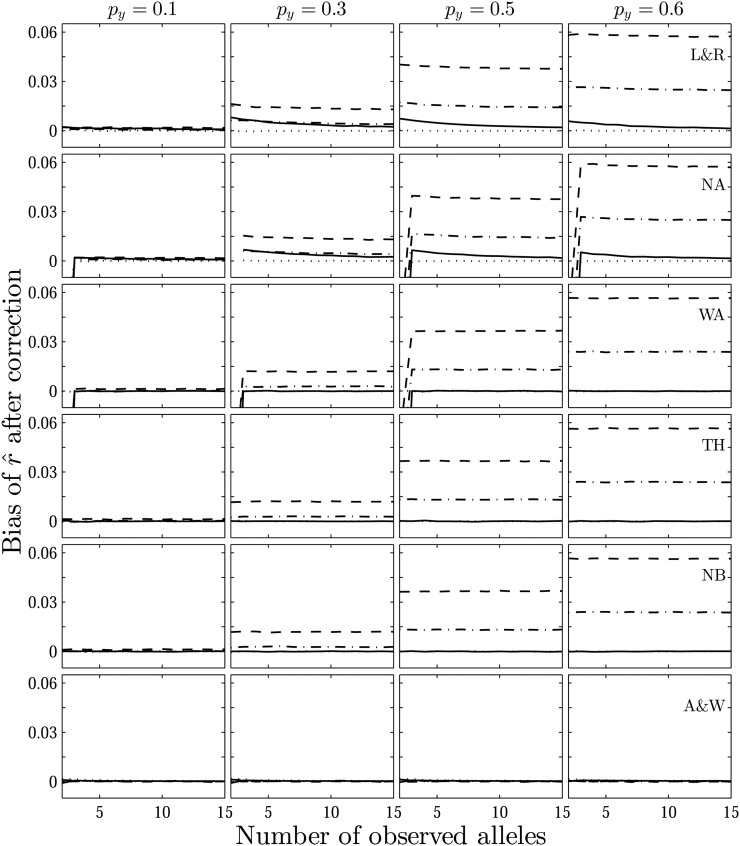
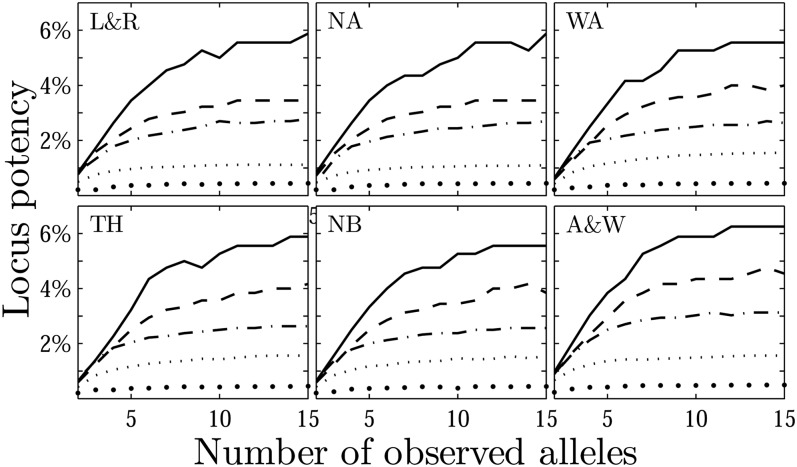
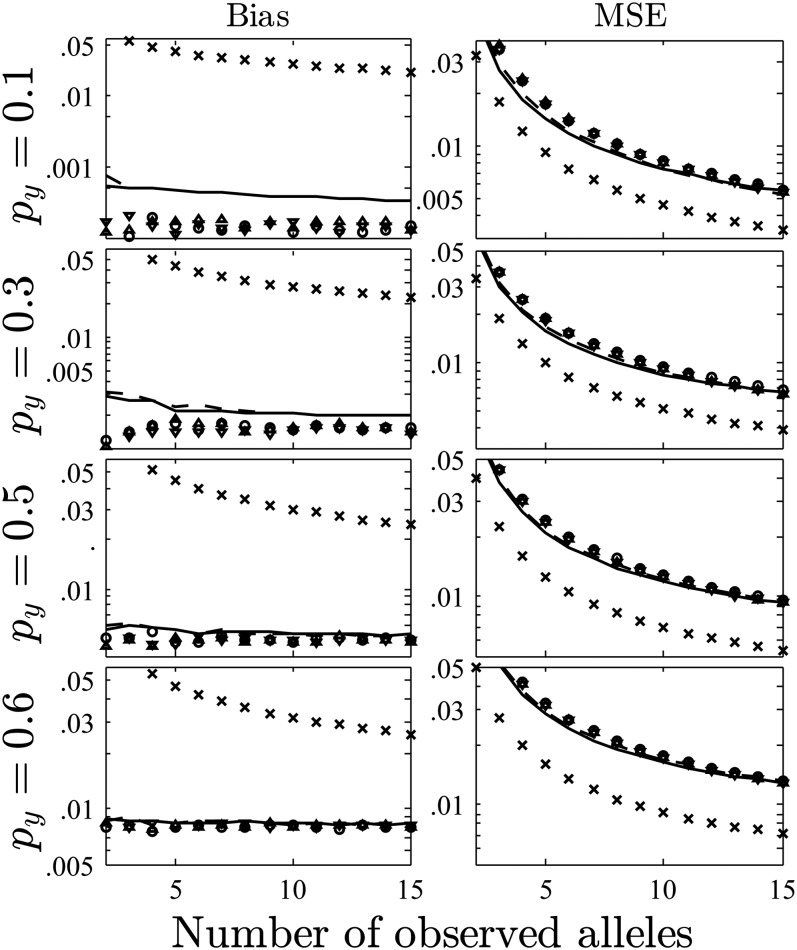
Studies of genetics and ecology often require estimates of relatedness coefficients based on genetic marker data. However, with the presence of null alleles, an observed genotype can represent one of several possible true genotypes. This results in biased estimates of relatedness. As the numbers of marker loci are often limited, loci with null alleles cannot be abandoned without substantial loss of statistical power. Here, we show how loci with null alleles can be incorporated into six estimators of relatedness (two novel). We evaluate the performance of various estimators before and after correction for null alleles. If the frequency of a null allele is <0.1, some estimators can be used directly without adjustment; if it is >0.5, the potency of estimation is too low and such a locus should be excluded. We make available a software package entitled PolyRelatedness v1.6, which enables researchers to optimize these estimators to best fit a particular data set.
Keywords: maximum likelihood; method-of-moment; null alleles; relatedness coefficient.
Copyright © 2016 by the Genetics Society of America.
Figures
Similar articles
-
Estimating relatedness and relationships using microsatellite loci with null alleles.Heredity (Edinb). 2006 Nov;97(5):336-45. doi: 10.1038/sj.hdy.6800865. Epub 2006 Jul 26. Heredity (Edinb). 2006. PMID: 16868566
-
A pairwise relatedness estimator for polyploids.Mol Ecol Resour. 2014 Jul;14(4):734-44. doi: 10.1111/1755-0998.12217. Epub 2014 Jan 27. Mol Ecol Resour. 2014. PMID: 24460904
-
A maximum-likelihood estimation of pairwise relatedness for autopolyploids.Heredity (Edinb). 2015 Feb;114(2):133-42. doi: 10.1038/hdy.2014.88. Epub 2014 Nov 5. Heredity (Edinb). 2015. PMID: 25370210 Free PMC article. Review.
-
Estimating pairwise relatedness between individuals with different levels of ploidy.Mol Ecol Resour. 2015 Jul;15(4):772-84. doi: 10.1111/1755-0998.12351. Epub 2014 Dec 23. Mol Ecol Resour. 2015. PMID: 25453904
-
Allele-sharing among affected relatives: non-parametric methods for identifying genes.Stat Methods Med Res. 2001 Feb;10(1):27-55. doi: 10.1177/096228020101000103. Stat Methods Med Res. 2001. PMID: 11329690 Review.
Cited by
-
A socially polymorphic Formica ant species exhibits a novel distribution of social supergene genotypes.J Evol Biol. 2022 Aug;35(8):1031-1044. doi: 10.1111/jeb.14038. Epub 2022 Jun 27. J Evol Biol. 2022. PMID: 35759556 Free PMC article.
-
Bachelor groups in primate multilevel society facilitate gene flow across fragmented habitats.Curr Zool. 2020 Apr;66(2):113-122. doi: 10.1093/cz/zoaa006. Epub 2020 Feb 20. Curr Zool. 2020. PMID: 32211037 Free PMC article.
-
Determining the level of extra-pair paternity in yellow-bellied prinias, a socially monogamous passerine.Zool Res. 2021 Jan 18;42(1):108-115. doi: 10.24272/j.issn.2095-8137.2020.079. Zool Res. 2021. PMID: 32987453 Free PMC article.
-
Genetic Structure and Evolutionary History of Rhinopithecus roxellana in Qinling Mountains, Central China.Front Genet. 2021 Jan 20;11:611914. doi: 10.3389/fgene.2020.611914. eCollection 2020. Front Genet. 2021. PMID: 33552131 Free PMC article.
-
Estimation of Molecular Pairwise Relatedness in Autopolyploid Crops.G3 (Bethesda). 2020 Dec 3;10(12):4579-4589. doi: 10.1534/g3.120.401669. G3 (Bethesda). 2020. PMID: 33051262 Free PMC article.
References
-
- Blouin M. S., 2003. DNA-based methods for pedigree reconstruction and kinship analysis in natural populations. Trends Ecol. Evol. 18: 503–511.
-
- Brookfield J. F. Y., 1996. A simple new method for estimating null allele frequency from heterozygote deficiency. Mol. Ecol. 5: 453–455. - PubMed
-
- Dabrowski M. J., Pilot M., Kruczyk M., Zmihorski M., Umer H. M., et al. , 2013. Reliability assessment of null allele detection: inconsistencies between and within different methods. Mol. Ecol. Resour. 14: 361–373. - PubMed
-
- Hall N., Mercer L., Phillips D., Shaw J., Anderson A. D., 2012. Maximum likelihood estimation of individual inbreeding coefficients and null allele frequencies. Genet. Res. 94: 151–161. - PubMed
Publication types
MeSH terms
Substances
LinkOut - more resources
Full Text Sources
Other Literature Sources
Research Materials
