

doi: 10.3389/fncir.2015.00044.
eCollection 2015.
The neocortical microcircuit collaboration portal: a resource for rat somatosensory cortex
Affiliations
- PMID: 26500503
- PMCID: PMC4597797
- DOI: 10.3389/fncir.2015.00044
Item in Clipboard
The neocortical microcircuit collaboration portal: a resource for rat somatosensory cortex
Front Neural Circuits.
.
No abstract available
Keywords: experimental data; ion channels; microcircuit; models; morphologies; neocortex; neurons; synapses.
Figures

An overview of the reconstructed microcircuit—facts and figures. Top left: facts and figures on the neuronal anatomy of the reconstructed microcircuit. Top right: overview of neuronal physiology. Bottom left: facts and figures on synaptic anatomy. Bottom right: overview of synaptic physiology.

Layer fact sheet. (A) The pathway navigator predicting the post-synaptic target layers of all m-types in layer 5. The thickness of a connecting ribbon indicates the number of possible pathways (connections or synapses, based on the user selection in the top left) of a given layer 5 m-type to the recipient layer. (B) Overview of the m-type composition in layer 5, morphometrics, and synaptic anatomy. (C) Proportional composition of different e-types in layer 5. (D) Map of commonly expressed calcium binding proteins and neuropeptides within inhibitory neurons of different m-types in layer 5. The thickness of the connecting ribbon indicates the prevalence of specific markers.

m-type fact sheet. (A) Predicted post-synaptic targets for neurons belonging to the L5_SBC m-type; (B1) anatomical fact sheet for all neurons of the L5_SBC m-type. (B2) e-types expressed in neurons belonging to the L5_SBC m-type (C) Histogram of axonal section bifurcation angles compiled from all reconstructed L5_SBC morphologies (N = 106). (D) Histogram of total axonal lengths. (E) Histogram of individual axonal section lengths. (F) Histogram of axonal volumes. (G) Histogram of dendritic section bifurcation angles. (H) Histogram of total dendritic lengths. (I) Histogram of individual axonal section lengths. (J) Histogram of dendritic volumes.

me-type fact sheet. (A) Anatomical properties of all neuron models belonging to the L5_SBC-dNAC me-type. (B) Physiological properties of all neuron models belonging to the L5_SBC-dNAC me-type. (C) Density distributions of ion channels used in neuron models. (D) Representative response traces in a L5_SBC_dNAC me-type model to different intensities of somatically injected step currents. (E) 3D reconstructed morphology of an exemplar L5_SBC neuron. (F) Predicted dendritic attenuation of EPSPs. (G) Predicted attenuation of the back-propagating AP.

Overview of in silico synaptic anatomy. (A) An exemplar in silico pair of synaptically connected L23_SBC (right, yellow) and L23_PC (left, black) neurons. The synaptic contacts mediating the connection are shown as yellow circles on the L23_PC. (B) Overlap of axo-dendritic density clouds of all pre-synaptic L23_SBCs and post-synaptic L23_PCs. (C) Overlap of axonal density clouds of all pre-synaptic L23_SBCs. (D) Axogram of the pre-synaptic L23_SBC showing the location of synaptic contacts (red circles) along the axon (in blue). (E) Overlap of dendritic density clouds of all pre-synaptic L23_PCs. (F) Dendrogram of the post-synaptic L23_PC, showing the location of synaptic contacts (blue circles) along the dendrites (in red).
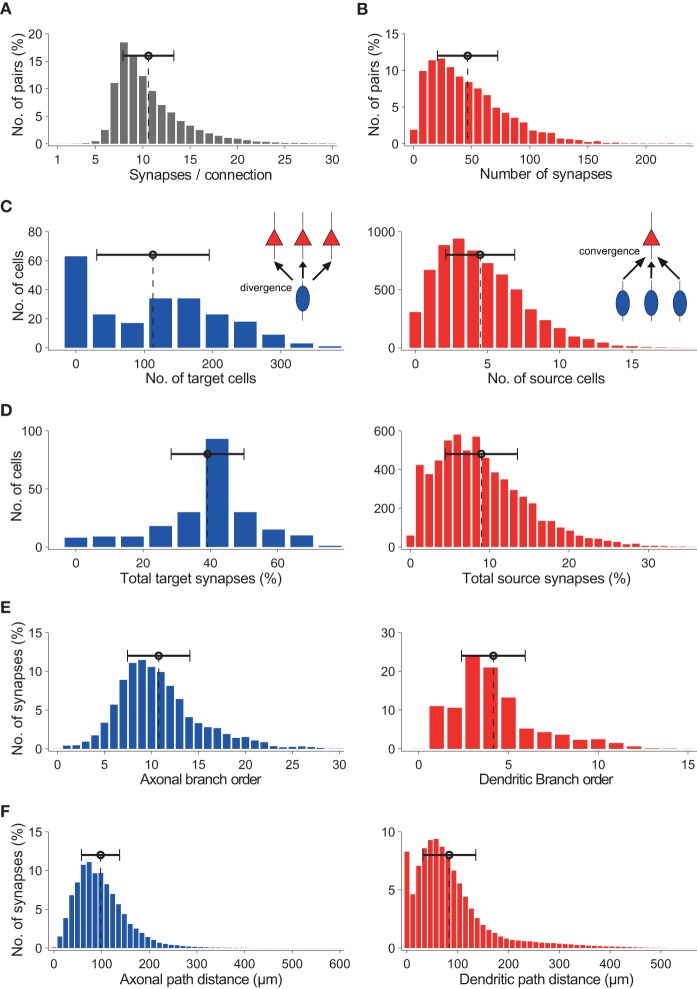
Characterization of in silico synaptic anatomy. (A) Distribution of number of synapses per connection for pairs of synaptically connected L23_SBC to L23_PC neurons. (B) Distribution of the total number of synapses from all L23_SBCs to L23_PCs. (C) Left: neuronal divergence; number of L23_PCs targeted by individual L23_SBCs. Right: neuronal convergence - number of L23_SBCs targeting individual L23_PCs. (D) Left: synaptic divergence - fraction of all synapses formed by L23_SBCs that target L23_PCs. Right: synaptic convergence; fraction of all synapses formed onto L23_PCs that originate from L23_SBCs. (E) Axonal (left) and dendritic (right) innervation patterns, in terms of branch order of synaptic contacts. (F) Same as (E), but in terms of geometrical distance of synaptic contacts.
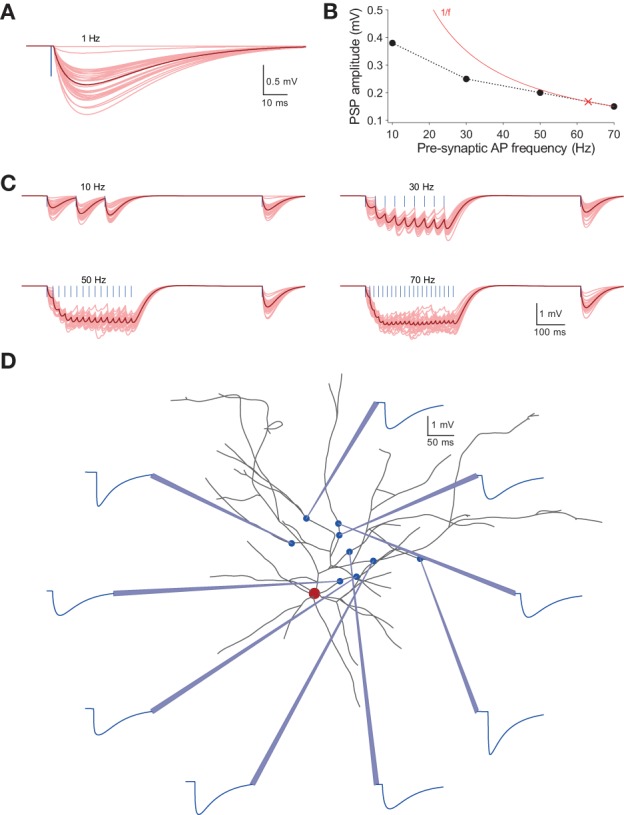
Overview of in silico synaptic physiology. (A) Average time course and amplitude of in silico unitary PSPs measured in a post-synaptic L23_PC by evoked unitary APs in a pre-synaptic L23_SBC (for the same pair of neurons shown in Figure 5A); blue line to the left indicates the pre-synaptic AP; pink traces, individual post-synaptic responses across 30 trials; red trace, average of 30 trials. (B) The 1/f rule demonstrating an inverse relationship between stationary PSPs and the frequency of pre-synaptic stimulation; the solid line in red shows the inverse relationship with frequency, and the cross shows the limiting frequency. (C) Frequency dependence of synaptic transmission. Clockwise from top left: in silico PSPs evoked in the post-synaptic L23_PC upon stimulating the pre-synaptic L23_SBC with pulse trains at frequencies of 10, 30, 70, and 50 Hz, respectively (for the same pair of neurons shown in Figure 5A). (D) The digital microcircuit reconstruction enables direct in silico recordings of single synaptic contacts on dendrites. For the synaptically connected pair (shown in Figure 5A), post-synaptic responses were recorded directly at synaptic locations on dendrites of the L23_PC (dendrites in black; soma in red); the connection was mediated by nine synaptic contacts (blue circles); dendritic recording sites are shown as light blue pipettes; corresponding PSPs are shown in blue.

Characterization of in silico synaptic physiology. (A) Histogram of in silico PSP amplitudes for synaptically connected pairs of L23_SBC and L23_PC neurons (n = 100 pairs, sampled at inter-somatic distances ≤ 100 μm); the dashed line in black indicates the mean of the distribution; the error bar shows the standard deviation (SD). (B) Histogram of in silico 20–80% PSP rise times. (C) Histogram of in silico PSP onset latencies. (D) Histogram of in silico PSP decay time constants. (E) Histogram of transmission failures. (F) Histogram of the c.v. of PSP amplitudes. (G) Predicted inverse relationship between the rate of transmission failures and PSP amplitude; the reconstructed microcircuit predicted a decrease in failure rates with increasing PSP amplitudes, consistent with a binomial model of transmitter release. (H) Same as in (G), but for c.v. of PSP amplitudes.

Predicted map of afferent synaptic input to, and efferent synaptic output from an exemplar L23_PC neuron. (A) Rendering of a L23_PC, predicting the map of afferent synapses color coded by m-type. (B,C) The intrinsic synaptic input and output, respectively from and to all m-, e-, and s-types across six layers for all L23_PCs in the reconstructed microcircuit.
References
Publication types
MeSH terms
LinkOut - more resources
Full Text Sources
Other Literature Sources
Molecular Biology Databases