. 2015 Oct 7:7:17.
doi: 10.3389/fnsyn.2015.00017. eCollection 2015.

Computational reconstitution of spine calcium transients from individual proteins

Affiliations

Computational reconstitution of spine calcium transients from individual proteins

Thomas M Bartol et al. Front Synaptic Neurosci. .

Abstract

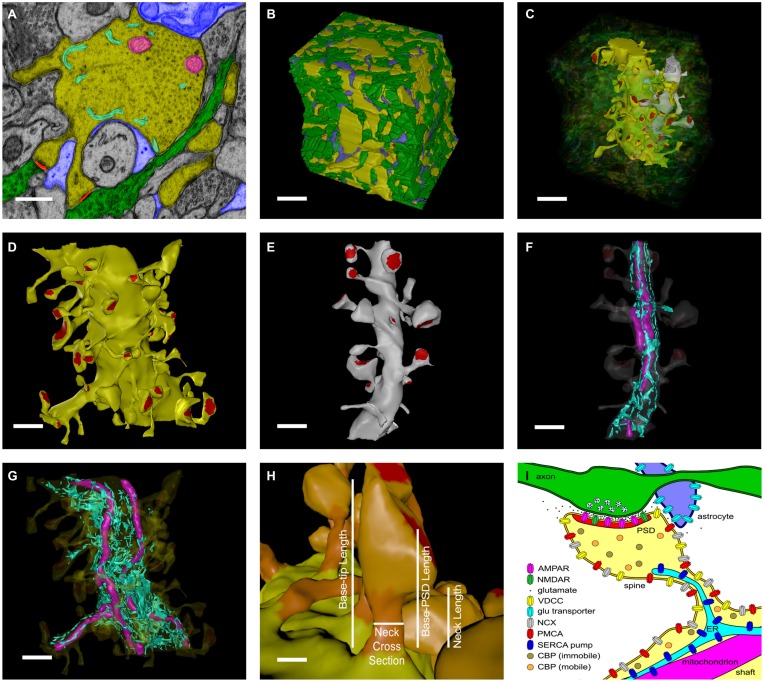
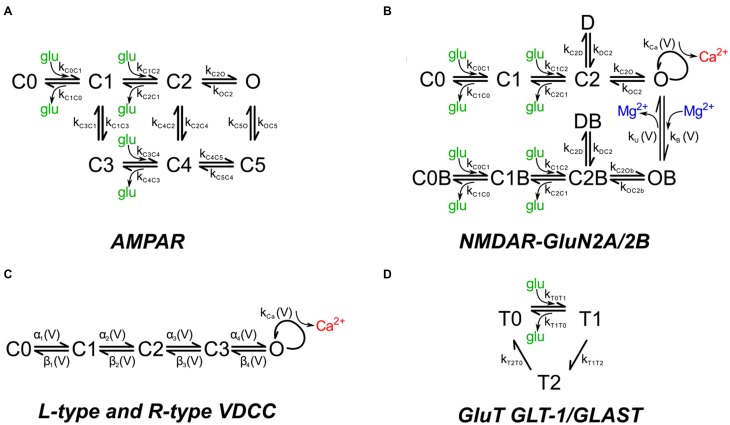
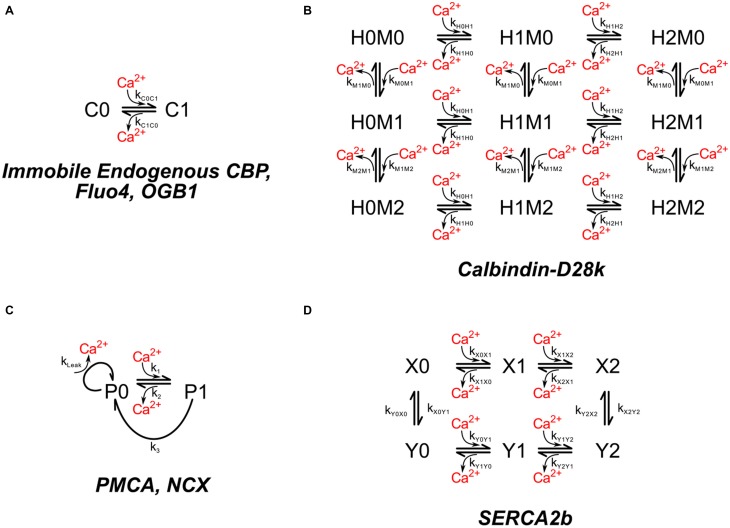
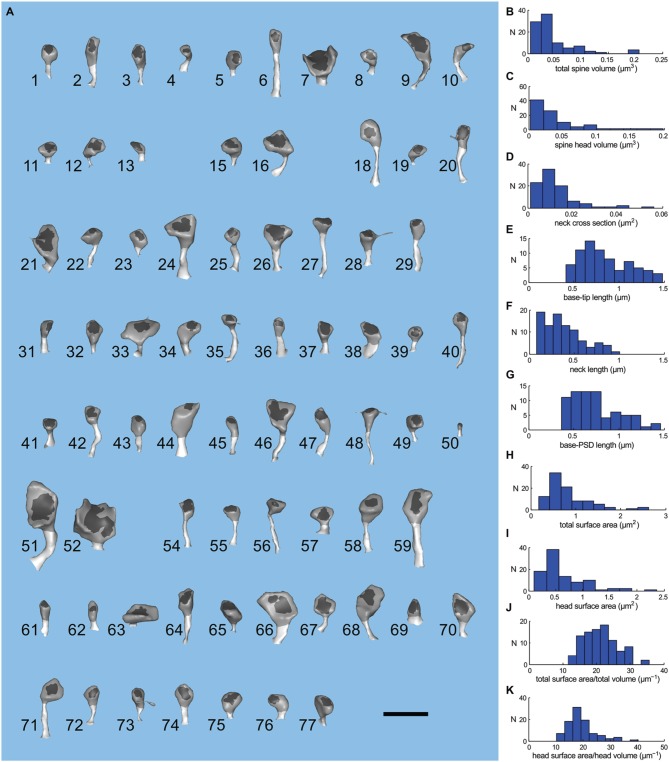
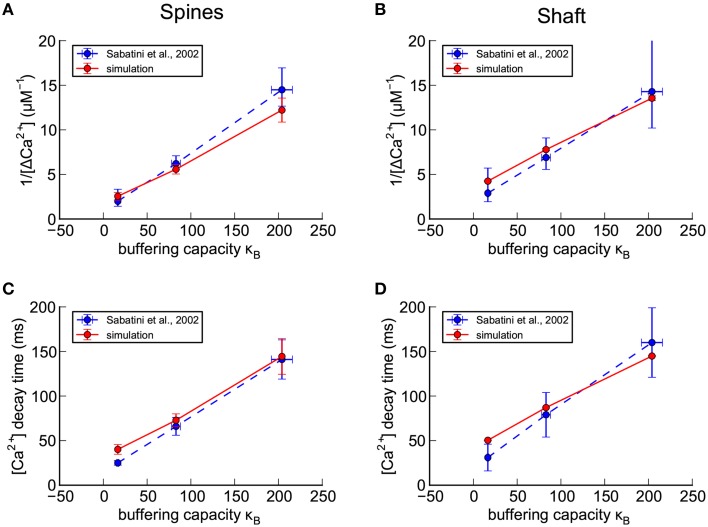
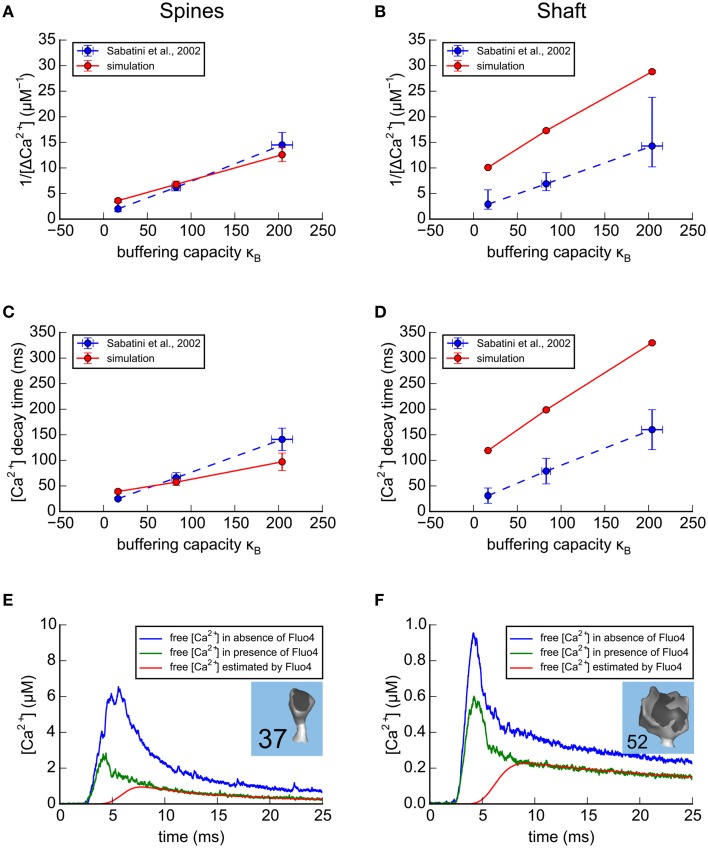
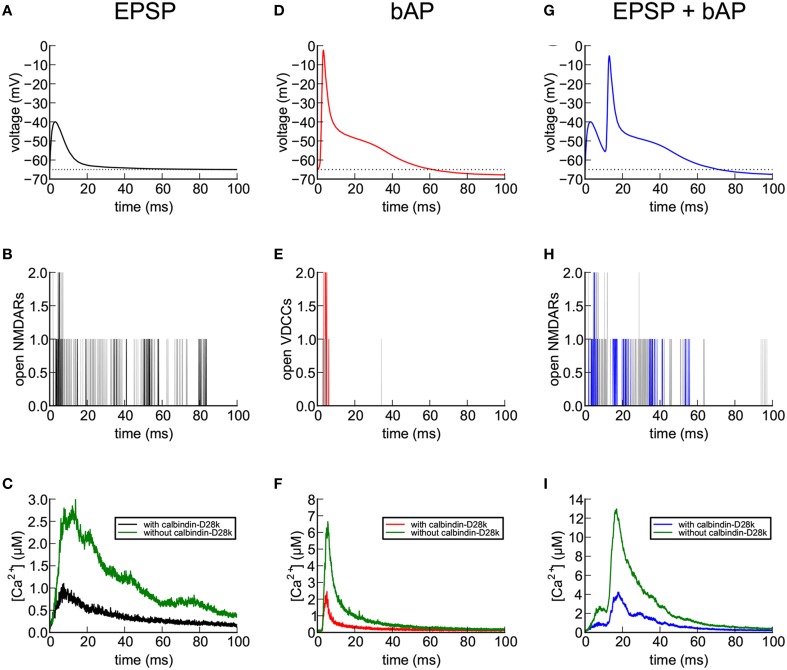
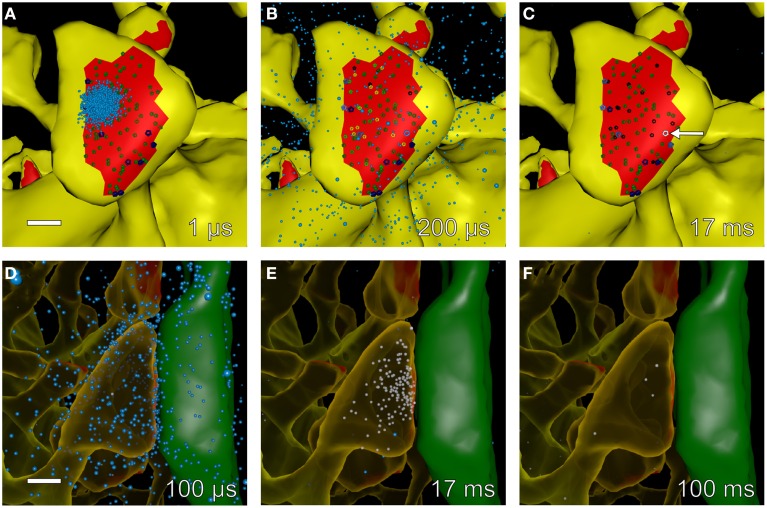
We have built a stochastic model in the program MCell that simulates Ca(2+) transients in spines from the principal molecular components believed to control Ca(2+) entry and exit. Proteins, with their kinetic models, are located within two segments of dendrites containing 88 intact spines, centered in a fully reconstructed 6 × 6 × 5 μm(3) cube of hippocampal neuropil. Protein components include AMPA- and NMDA-type glutamate receptors, L- and R-type voltage-dependent Ca(2+) channels, Na(+)/Ca(2+) exchangers, plasma membrane Ca(2+) ATPases, smooth endoplasmic reticulum Ca(2+) ATPases, immobile Ca(2+) buffers, and calbindin. Kinetic models for each protein were taken from published studies of the isolated proteins in vitro. For simulation of electrical stimuli, the time course of voltage changes in the dendritic spine was generated with the desired stimulus in the program NEURON. Voltage-dependent parameters were then continuously re-adjusted during simulations in MCell to reproduce the effects of the stimulus. Nine parameters of the model were optimized within realistic experimental limits by a process that compared results of simulations to published data. We find that simulations in the optimized model reproduce the timing and amplitude of Ca(2+) transients measured experimentally in intact neurons. Thus, we demonstrate that the characteristics of individual isolated proteins determined in vitro can accurately reproduce the dynamics of experimentally measured Ca(2+) transients in spines. The model will provide a test bed for exploring the roles of additional proteins that regulate Ca(2+) influx into spines and for studying the behavior of protein targets in the spine that are regulated by Ca(2+) influx.

Keywords: calcium channels; calcium pumps; dendritic spines; synaptic calcium; synaptic plasticity.


Figures

Figure 1
Figure 1
Reconstruction of hippocampal neuropil. (A) Hand segmentation of 2D-objects within a single EM thin section. The entire reconstruction consisted of 100 serial EM thin sections 50 nm thick. Each plasma membrane bound structure was traced in each thin section but only a few structures are highlighted here for illustrative purposes. A large apical dendrite is highlighted in yellow along with its enclosed endoplasmic reticulum (cyan) and mitochondria (magenta). Spines that are part of the principal dendrite, also shown in yellow, sometimes appear disjoint from the dendrite in a given thin section. Two axons that make synaptic contacts with two spines of the large apical dendrite in this plane of section are shown in green. PSDs and presynaptic active zones were annotated by enclosing them in a separate close-fitting contour (red). Processes of an astrocytic glial cell are shown in blue. Scale bar is 0.5 μm. (B) Reconstructed volume of neuropil. Dendrites are yellow. Axons are green. Astrocyte is blue. The extracellular space was adjusted so that the distance between components was 20 nm using an algorithm described in Kinney et al. (2013). Scale bar is 1 μm. (C) Two dendrites in the reconstructed volume were selected for simulations of glutamatergic synaptic transmission and postsynaptic calcium dynamics. A large apical dendrite is shown in yellow and a smaller branch dendrite is shown in light gray. The selected dendrites are shown in relation to one another embedded in the semitransparent neuropil. The synaptic contact areas (red) on the two selected dendrites were identified and labeled as shown in (D,E). Scale bar is 1 μm. (D,E) The PSD regions (red) of the large apical dendrite (D) and the smaller branch dendrite (E) were annotated. Scale bar is 1 μm. (F,G) Intracellular organelles of the small branch dendrite (F) and large apical dendrite (G), including the reconstructed endoplasmic reticulum (cyan) and mitochondria (magenta). Scale bar is 1 μm. (H) The spine head (light-orange), neck (dark-orange), and dendritic shaft (yellow) were also annotated. Geometric measurements used in the analysis are shown as annotations. The neck cross section area was measured at a point halfway along the length of the neck. Scale bar is 0.25 μm. (I) Summary of all neuropil elements included in the model. The PSD was used to lasso a region of the spine surface for NMDAR and AMPAR placement. Presynaptic vesicles are shown for illustration only and were not included in simulations; instead glutamate was released directly into the synaptic cleft (see Methods Section). Note that about 19% of spines in the reconstruction contained ER protruding from the dendritic shaft into the spine neck and head.
Figure 2
Figure 2
Chemical kinetic schemes of receptors, Ca2+ channels, and glutamate transporter. The kinetic rate constants for the reaction pathways are given in Table 1. (A) Glutamate-gated AMPAR with a mixture of GluA1 and GluA2 subunits and (B) glutamate-gated NMDA receptor with a mixture of GluN2A (NR2A) and GluN2B (NR2B) subunits were distributed on the dendritic spine head plasma membrane associated with the PSD. Mg2+ block was modeled by the asymmetric trapping block model of Vargas-Caballero and Robinson (2004). (C) Voltage-dependent Ca2+ channels on the spine head and neck are the sole source of calcium during backpropagating action potentials. (D) Glutamate transporter representing a combination of GLT-1 and GLAST transporter subtypes were distributed on the astrocytic glial processes.
Figure 3
Figure 3
Chemical kinetic schemes of endogenous Ca2+ buffer, calbindin-D28k, Ca2+ pumps, and Na+–Ca2+ exchanger. (A) The interaction of Ca2+ with immobile endogenous CBPs was modeled as a simple first-order reversible reaction. Molecules of immobile endogenous CBPs were distributed throughout the volume of the dendritic and spine cytoplasm. (B) The mobile high affinity calcium buffer calbindin-D28k was included in the dendritic and spine cytoplasm. (C) Ca2+ pumps PMCA, and NCX were modeled with identical kinetic schemes but different rate constants. PMCA and NCX pumps were placed on the spines and dendritic shafts. (D) The SERCA pump was placed on ER membrane.
Figure 4
Figure 4
Geometry of spines of the large apical dendrite. (A) Visual index of the spines of the large apical dendrite. Spines have been oriented to view both head and neck. The PSD region is dark gray; spine head, medium gray; and spine neck, light gray. The spines are numbered 1–77 and have not been sorted. Five spines (numbers 14, 17, 30, 53, and 60) were omitted from the simulations because they were clipped by the boundary of the reconstructed volume. Thus, the apical dendritic segment contains 72 intact spines. The scale bar is 1 μm. (B–K) Distribution of geometric parameters of the spines. (B) Total spine volume. (C) Spine head volume. The average spine head volume in the sample was 0.03 μm3. (D) Spine neck cross sectional area. (E) Base-tip length. The average spine length from the base of the spine to the apex of the head was 0.85 μm. (F) Spine neck length. (G) Base to PSD length. (H) Total surface area. (I) Head surface area. (J) Ratio of total spine surface area to total spine volume. (K) Ratio of head surface area to head volume.
Figure 5
Figure 5
Calibration of nine parameters in spines and shafts of the small branch spine. (A–D) Confirmation of calibration of the shape of a Ca2+ transient in response to a bAP in the absence of calbindin (see Methods Section). For comparison with experimental results of Sabatini et al. (; shown as blue dashed lines), concentrations of exogenous fluorescent calcium indicators in the model were set to 20 μM Fluo4, 50 μM OGB1, or 100 μM OGB1. The simulated results for the best calibrated parameters, averaged for seven spines with volumes ≥ 0.05 fl, are shown as red lines. (A) For each concentration of indicator, the reciprocal of the averaged peaks of the calcium transients in the spines, 1/Δ[Ca2+], is plotted against the buffering capacity in the presence of indicator (κB) calculated as in Sabatini et al. (2002). The Δ[Ca2+], extrapolated to zero indicator, was in the range 0.5 to 1.0 μM (reciprocal of y-axis intercept) with κe in the range 16–50 (x-axis intercept). (B) The reciprocal of the averaged peaks of the calcium transients in the dendritic shaft is plotted against buffering capacity. The Δ[Ca2+], extrapolated to zero indicator, was 0.3 μM with κe = 62. (C) The averaged time constant of calcium decay in the spines is plotted against calcium buffering capacity. The calcium decay time constant, extrapolated to zero indicator in the spines was in the range 20–40 ms (y-axis intercept) with κe in the range 30–80 (x-axis intercept). (D) The averaged time constant of calcium decay in the dendritic shafts was plotted against buffering capacity. The calcium decay time constant, extrapolated to zero indicator in the dendritic shafts was 42 ms with κe = 75.
Figure 6
Figure 6
Results of simulations in the spines and shafts of the large apical dendrite using parameters optimized for the small branch dendrite. (A–D) Simulation of Ca2+ transients in response to a bAP in the absence of calbindin. As in Figure 5, for comparison with experimental results of Sabatini et al. (; shown as blue dashed lines), concentrations of exogenous fluorescent Ca2+ indicators in the model were set to 20 μM Fluo4, 50 μM OGB1, or 100 μM OGB1. The simulated results in the large apical dendrite, averaged for the 13 spines with volumes ≥0.05 fl are shown as red lines. (A) For each concentration of indicator, the reciprocal of the averaged peaks of the Ca2+ transients in the spines of the large apical dendrite, 1/Δ[Ca2+], is plotted against the buffering capacity in the presence of indicator (κB) calculated as in Sabatini et al. (2002). The Δ[Ca2+], extrapolated to zero indicator, was in the range 0.3–0.6 μM (reciprocal of y-axis intercept) with κe in the range 40–75 (x-axis intercept). (B) The reciprocal of the averaged peaks of the Ca2+ transients in the dendritic shaft is plotted against buffering capacity. The Δ[Ca2+], extrapolated to zero indicator, was 0.12 μM with κe = 75. (C) The averaged time constant of Ca2+ decay in the spines is plotted against Ca2+ buffering capacity. The Ca2+ decay time constant, extrapolated to zero indicator in the spines was 25 to 40 ms (y-axis intercept) with κein the range 60–120 (x-axis intercept). (D) The averaged time constant of Ca2+ decay in the dendritic shafts was plotted against buffering capacity. The Ca2+ decay time constant, extrapolated to zero indicator in the dendritic shafts was 100 ms with κe = 80. (E,F) Ca2+ transients in two spines of the calibrated model, in response to a bAP. Simulations were run in the presence and absence of 20 μM Fluo4 in a median size spine (E, spine #37, average of 32 trials) and in a large-size spine (F, spine #52, average of 59 trials). The average Ca2+ transients that would be estimated from the fluorescence of 20 μM Fluo4 are shown in red. The average Ca2+ transients, measured in the simulation by counting actual free Ca2+, are shown in the presence of Fluo4 (green), and in its absence (blue).
Figure 7
Figure 7
Calcium entry into spines in response to EPSP, bAP, and EPSP+bAP stimuli. Unless otherwise stated, the dendrite contained 45 μM calbindin-D28k and the signals are those recorded in spine #37. (A) Depolarization of the spine head following an EPSP stimulus. The voltage signal was generated from a NEURON simulation, as described in Methods Section. (B) NMDARs flickered between open and closed states during an EPSP. The black trace shows a single trial. Gray traces are superposition of five additional trials. (C) Ca2+ transients in the spine head in response to a single EPSP stimulus averaged over 56 trials in the presence (black) and absence (green) of calbindin-D28k. (D) Depolarization of the spine head following a bAP stimulus. The voltage signal was generated from a NEURON simulation as described in Methods Section). (E) VDCCs flickered between open and closed states during the bAP. The red trace shows a single trial. Gray traces are superposition of five additional trials. (F) Ca2+ transients in the spine head in response to a single bAP stimulus averaged over 32 trials in the presence (red) and absence (green) of calbindin-D28k. (G) Depolarization of the spine head following an EPSP+bAP stimulus. The voltage signal was generated from a NEURON simulation as described in Methods Section. (H) NMDARs flickered between open and closed states during an EPSP+bAP. The blue trace shows a single trial. Gray traces are superposition of five additional trials. (I) Ca2+ transients in the spine head in response to a single EPSP+bAP stimulus averaged over 86 trials in the presence (blue) and absence (green) of calbindin-D28k.
Figure 8
Figure 8
Snapshots of simulated glutamate release and postsynaptic calcium dynamics at different times during an EPSP+bAP stimulus. We used Cell Blender (see Methods Section) to visualize simulated glutamate release and calcium entry into spine #37 (see Figure 4A) during an EPSP+bAP stimulus. All other components of the neuropil were present in the simulation but are not displayed in the visualization. All scale bars are 0.25 μm. (A–C) Time-lapse sequence of glutamate (cyan dots) released onto a dendritic spine with unbound AMPARs (smaller, dark-green glyphs) and unbound NMDARs (larger, dark-blue glyphs). Snapshots (A–C) were made from data generated by MCell during a single trial and taken at 1, 200 μs, and 17 ms after glutamate release, respectively. Glutamate diffused rapidly throughout the synaptic cleft, binding to AMPARs and NMDARs. Singly bound AMPARs are shown as medium-green glyphs, doubly bound AMPARs as bright-green glyphs, open AMPARs as yellow glyphs, and desensitized AMPARs as black glyphs. Singly bound NMDARs are shown as medium-blue glyphs, doubly bound NMDARs as bright-blue glyphs, and open NMDARs as white glyphs. During this trial the peak of AMPAR activation occurred at ~200 μs and the peak of NMDAR activation occurred at ~17 ms when a single NMDAR flickered open (white glyph indicated by white arrow in C). (D–F) Time-lapse sequence of glutamate decay and calcium influx after stimulation. Snapshots for (D–F) were made from data generated by MCell during a single trial and taken at 100 μs, 17, and 100 ms after glutamate release, respectively. The presynaptic axon (green) on the right makes an en passant synapse with the postsynaptic spine (translucent yellow) on the left. Free glutamate molecules (cyan dots) diffuse from the synaptic cleft within a few microseconds and are taken up within a 100 ms by astroglial transporters (not visualized but present in the simulation). Some glutamate remains bound and activates NMDARs for many tens of microseconds allowing influx of calcium (white dots) as NMDARs flicker open and closed. In this example, calcium entered the spine through a single open NMDAR and was cleared from the spine head via calcium pumps in the spine membrane and by diffusion through the spine neck.
Figure 9
Figure 9
Fate maps of Ca2+ entering spines #37 and #52 in response to EPSP+bAP. The fate of all Ca2+ entering the spines was tracked for 100 ms after the stimulus. While inside the spine, Ca2+ can diffuse freely (blue) or bind to Ca2+-binding proteins and pumps (yellow). To restore the resting state, Ca2+ that enters is removed from the spine by PMCA pumps (red), NCX exchangers (white), or via diffusion through the spine neck (green) as free Ca2+ or while bound to mobile calbindin. (A,C,E) Fate of Ca2+ in median-size spine #37; (A) after a bAP in the absence of calbindin, (C) a bAP in the presence of calbindin, or (E) an EPSP+bAP in the presence of calbindin. (B,D,F) Fate of Ca2+ in large spine #52; (B) after a bAP in the absence of calbindin, (D) a bAP in the presence of calbindin, or (F) an EPSP+bAP in the presence of calbindin. Data is represented as a fraction of the total Ca2+ influx. The actual number of Ca2+ ions tracked is indicated in the y-axis label.

References

    1. Allbritton N. L., Meyer T., Stryer L. (1992). Range of messenger action of calcium ion and inositol 1,4,5-trisphosphate. Science 258, 1812–1815. 10.1126/science.1465619 - DOI - PubMed
    1. Arriza J. L., Fairman W. A., Wadiche J. I., Murdoch G. H., Kavanaugh M. P., Amara S. G. (1994). Functional comparisons of three glutamate transporter subtypes cloned from human motor cortex. J. Neurosci. 14, 5559–5569. - PMC - PubMed
    1. Baba-Aissa F., Raeymaekers L., Wuytack F., De Greef C., Missiaen L., Casteels R. (1996). Distribution of the organellar Ca2+ transport ATPase SERCA2 isoforms in the cat brain. Brain Res. 743, 141–153. 10.1016/S0006-8993(96)01037-2 - DOI - PubMed
    1. Bartol T. M. (1992). A Study of Miniature Endplate Current Generation at the Vertebrate Neuromuscular Junction using Electrophysiology and Monte Carlo Simulation. Ph.D. thesis, Cornell University, Ithaca, NY. - PMC - PubMed
    1. Bergles D. E., Tzingounis A. V., Jahr C. E. (2002). Comparison of coupled and uncoupled currents during glutamate uptake by GLT-1 transporters. J. Neurosci. 22, 10153–10162. - PMC - PubMed