. 2015 Nov;21(11):1364-71.
doi: 10.1038/nm.3973. Epub 2015 Oct 26.

Ductal pancreatic cancer modeling and drug screening using human pluripotent stem cell- and patient-derived tumor organoids

Affiliations

Ductal pancreatic cancer modeling and drug screening using human pluripotent stem cell- and patient-derived tumor organoids

Ling Huang et al. Nat Med. 2015 Nov.

Abstract

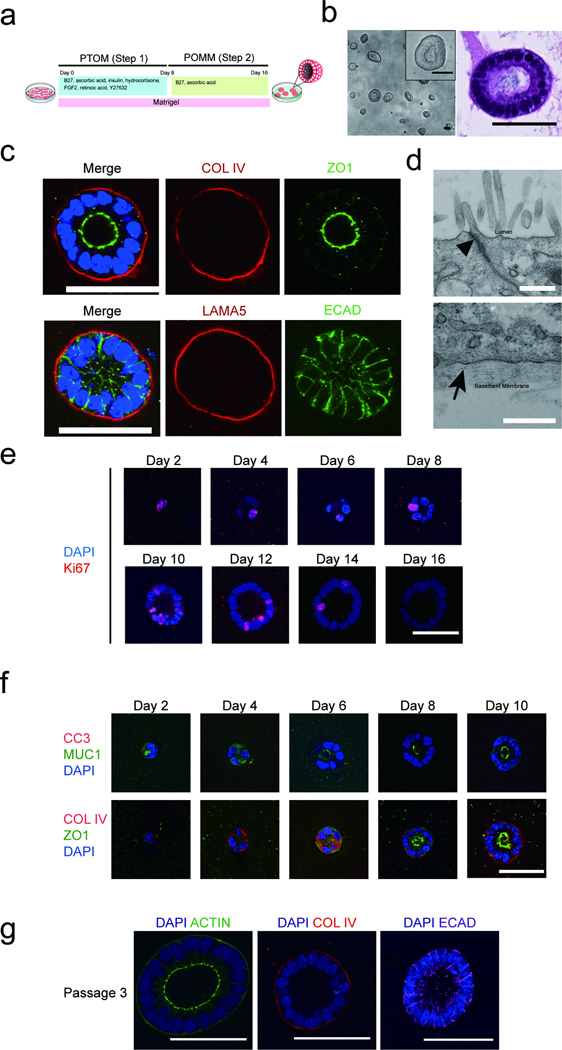
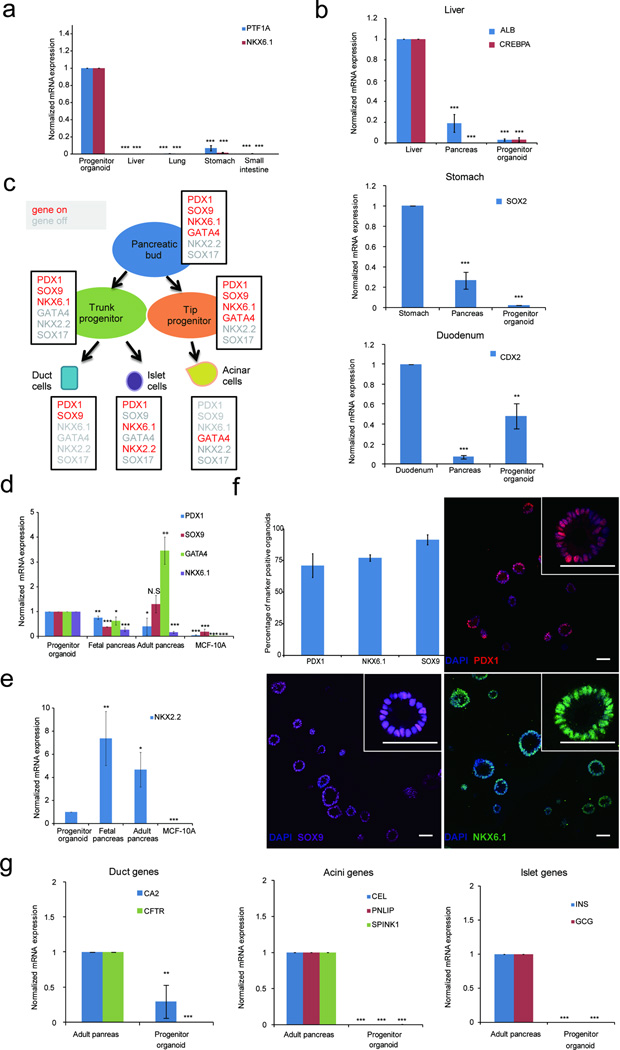
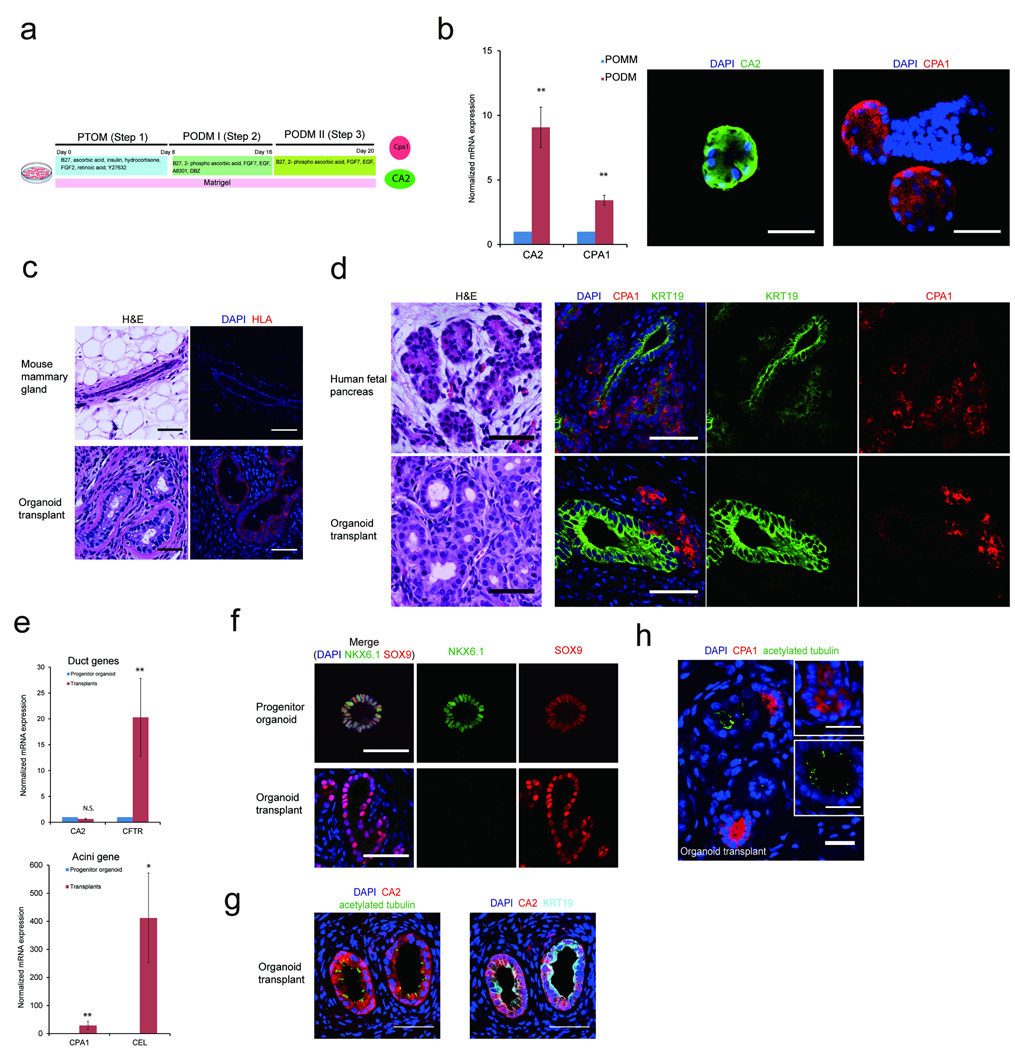
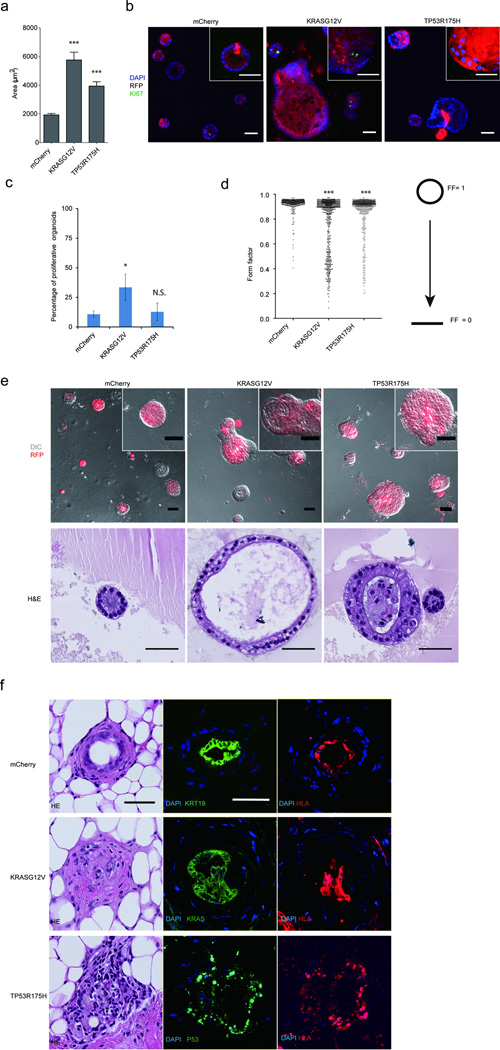
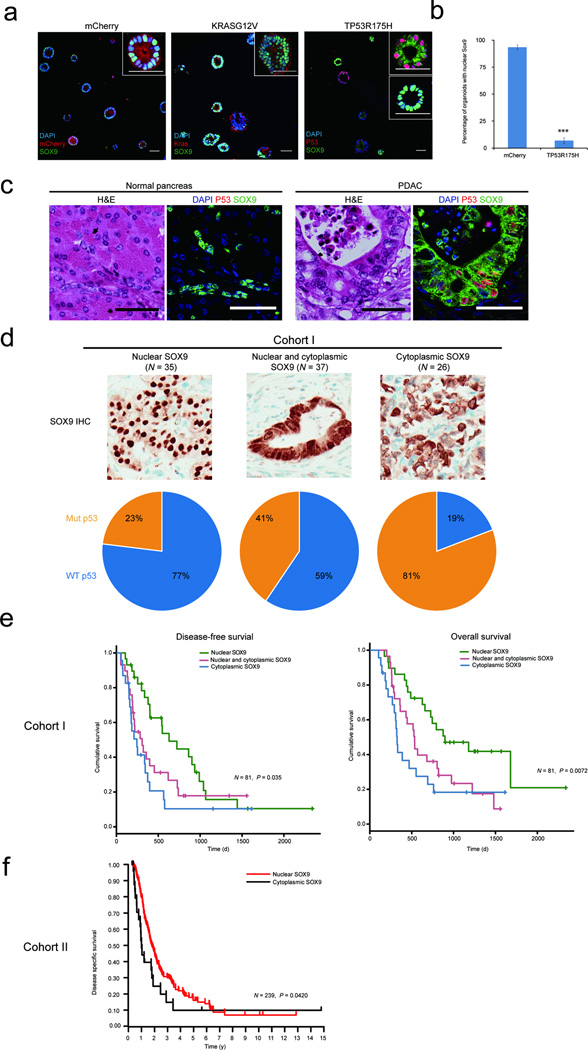
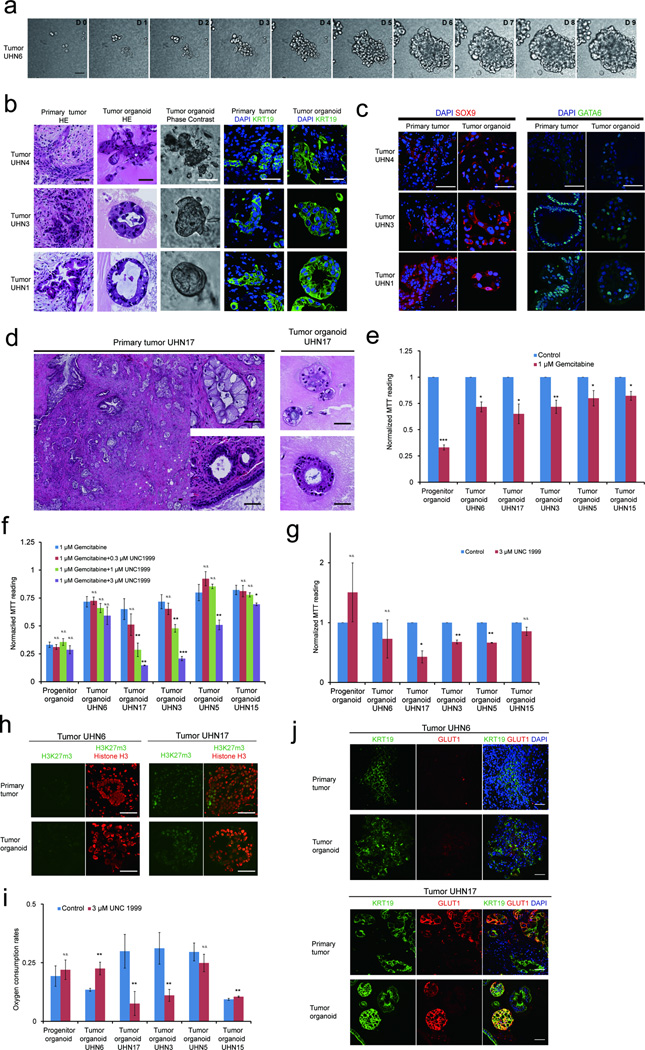
There are few in vitro models of exocrine pancreas development and primary human pancreatic adenocarcinoma (PDAC). We establish three-dimensional culture conditions to induce the differentiation of human pluripotent stem cells into exocrine progenitor organoids that form ductal and acinar structures in culture and in vivo. Expression of mutant KRAS or TP53 in progenitor organoids induces mutation-specific phenotypes in culture and in vivo. Expression of TP53(R175H) induces cytosolic SOX9 localization. In patient tumors bearing TP53 mutations, SOX9 was cytoplasmic and associated with mortality. We also define culture conditions for clonal generation of tumor organoids from freshly resected PDAC. Tumor organoids maintain the differentiation status, histoarchitecture and phenotypic heterogeneity of the primary tumor and retain patient-specific physiological changes, including hypoxia, oxygen consumption, epigenetic marks and differences in sensitivity to inhibition of the histone methyltransferase EZH2. Thus, pancreatic progenitor organoids and tumor organoids can be used to model PDAC and for drug screening to identify precision therapy strategies.


Figures

Figure 1
Figure 1. Induction of polarized organoids from human pluripotent stem cells
(a) A schematic diagram of the protocol for growing pancreatic lineage committed pluripotent stem cells (PSCs) on a 3D platform. PTOM refers to Pancreatic Progenitor and Tumor organoid Media and POMM refers to Pancreatic Organoid Maintenance Media. See online methods for details. (b) Phase morphology of day 16 organoids (left panel) with insert representing higher magnification image of one organoid. H&E staining of one organoid (right panel). (c) Confocal images of day 16 organoids immunostained for basal markers COLLAGEN IV (COLIV) or LAMININ α5 (LAMA5) (red), tight junction marker (ZO1, green), cell-cell junction marker, E-CADHERIN (ECAD, green) and DAPI (blue). (d) Transmission electron micrograph of cells from day 16 3D organoids. Upper panel: apical region of epithelia, arrowhead pointing to an electron dense region representing tight junctions. Lower panel: basal region of polarized epithelia with the arrowhead pointing to basement membrane. Scale bars, 0.5 µm. (e) Staining for Ki67 at different days in 3D culture. DAPI, blue; Ki67, red. (f) Cell polarization and apoptosis during pancreatic organoid morphogenesis. Top panel: apoptosis marker Cleaved Capase-3 (CC3, red), and apical maker MUCIN1 (MUC1, green), DAPI (blue). Bottom panel: basal and apical markers COLIV (red) and ZO1 (green), respectively in progenitor organoids from day 2 to day 10 in 3D culture. (g) Maintenance of polarity upon serial passaging of organoids as shown by staining for ACTIN (green), COL IV (red) and ECAD (purple). Scale bars represent 50 µm, unless specified otherwise.
Figure 2
Figure 2. Organoids express markers associated with pancreatic progenitor cells
(a) Expression of pancreas exocrine specific marker genes in 3D organoids and human fetal endodermal tissues. (b) Expression of markers for liver (ALB, CREBPA), stomach (SOX2) and duodenum (CDX2) in 3D organoids, human fetal pancreas and positive control (fetal liver or fetal stomach or fetal duodenum). (c) A schematic summarizing expression patterns of transcription factors during human embryonic pancreas development. Expressed genes are in red; repressed genes are in grey, adapted from Jennings et al. (d) Expression of pancreas markers in 3D organoids, MCF-10A mammary epithelial cells used as non-specific control. (e) Expression of NKX2.2, a pancreatic endocrine marker gene. (f) Expression of markers in 3D organoids as detected by immunofluorescence. Images show representative fields and inserts show one organoid at a higher magnification. Scale bars, 50 µm. Graph summarizes results from three independent sets of experiments with over 100 organoids counted for each experiment. An organoid was designated as marker positive when more than 50% cells were positive for expression. (g) Expression of markers associated with differentiated ductal, acinar or islet cells. CA2, carbonic anhydrase II; CFTR, cystic fibrosis transmembrane conductance regulator; CEL, carboxyl ester lipase; PNLIP, pancreatic lipase; SPINK1, serine peptidase inhibitor 1; INS, insulin; GCG, glucagon. For all qPCR experiments data represent mean +/− S.E.M. P value (t-test, two tailed): N.S. - not significant; *P = 0.01 – 0.05; **P= 0.001 – 0.01; ***P = < 0.001 (N = 3 biological repeats).
Figure 3
Figure 3. Differentiation of pancreatic progenitor organoids in vitro and in vivo
(a) Schematic representation of the protocol for inducing progenitor organoids into ductal and acinar cells in culture. PTOM refers to Pancreatic Progenitor and Tumor organoid Media; PODM I and PODM II refer to Pancreatic Organoid Differentiation Media I and II. (b) QPCR analysis for ductal (CA2) and acinar (CPA1) markers. Immunofluorescence analysis of CA2 (green) and CPA1 (red) expression. (c) Top panel: H&E morphology of mammary ducts of control glands (left) and immunofluoresence for human leukocyte antigen (HLA), (right, HLA-Red). Bottom panel: organoid transplants stained with H&E (left) or for HLA (right). Transplants were identified in 20 out of 22 glands analyzed. (d) Comparative analysis of organization of H&E stained human fetal pancreas (top) with transplants (bottom) and immunofluorescence using ductal (KRT19, green), and acinar (CPA1, red) markers. (e) QPCR analysis showing expression of acinar (CPA1, CEL) and ductal (CA2, CFTR) markers relative to the progenitor organoids in transplants. (f) NKX6.1 expression in, progenitor organoids in culture (top) and ducts in transplants (bottom). DAPI, blue; NKX6.1, green; SOX9, red. (g) Transplants immunostained for ductal markers CA2 (red), KRT19 (cyan), primary cilia (acetylated tubulin, green) and DAPI (blue). (h) Transplants immunostained for ductal marker, primary cilia (acetylated tubulin, green) and acinar marker (CPA1, red) and DAPI (blue). All scale bars represent 50 µm. P = 0.01 – 0.05; **P= 0.001 – 0.01; ***P = < 0.001 (N = 3 biological repeats).
Figure 4
Figure 4. Progenitors organoids model early PDAC
(a) Areas of progenitor organoids expressing transgenes. (b) Representative images of mCherry, TP53R175H and KRASG12V expressing structures stained for Ki67 (green), RFP (red) and DAPI (blue). (c) Quantification of the percentage of proliferative organoids. (d) Form factor (FF) analysis, a continuous scale where a perfect circle is represented by FF=1 and a linear line by FF=0. (e) Overlay of DIC and fluorescent images of KRASG12V and TP53R175H expressing structures (top) and sections stained with H&E (bottom panel). All quantification graphs summarize three independent experiments with N >100 structures assessed in all cases, N.S-, not significant; * P = 0.01 – 0.05; ** P = 0.001 – 0.01; ***P = < 0.001 (N = 3 biological repeats). (f) Transplant outgrowths from progenitor organoids expressing mCherry, KRASG12V or TP53R175H. Morphologies of organoid-derived structures are shown by H&E images. Expression of Keratin19 (KRT19, green), KRAS (green) or TP53 (green), DAPI (blue) as well as human marker HLA (red) are shown in immunofluorescent images. All scale bars represent 50 µm.
Figure 5
Figure 5. TP53 mutational status, localization of SOX9 and clinical outcome
(a) Control vector (mCherry), or KRASG12D or TP53R175H expressing organoids co-stained for SOX9 (green) and KRAS or TP53 (red), DAPI, blue. Insets represent high-resolution images of representative organoids. (b) Quantification of nuclear SOX9 in mCherry- and TP53R175H-expressing pancreatic progenitor organoids. Graph summarizes results from three independent sets of experiments with over 50 structures counted in each experiment. ***P =< 0.001. (c) H&E and immunostaining for TP53 (P53, red) SOX9 (green) in normal pancreas and PDAC. Scale bars, 50 µm. (d) Representative images of chromogenic IHC staining showing nuclear, nuclear-cytoplasmic and cytoplasmic SOX9 staining (top panel). Samples with different SOX9 status scored for TP53 mutation status and expressed as percentage (lower panel). WT refers to Wild type. (e) Kaplan-Meier curve representing disease free survival (DFS) an overall survival (OS) of patients in cohort I with nuclear (green, N = 29), nuclear and cytoplasmic (red, N = 29), or cytoplasmic SOX9 (blue, N = 23). (f) Kaplan-Meier curve representing disease specific survival of patients in cohort II with cytoplasmic (black, N = 26) or nuclear SOX9 (red, N = 213).
Figure 6
Figure 6. Establishment of tumor organoids that conserve patient specific traits
(a) Time lapse imaging sequence of UHN6 organoids. (b) H&E, phase and immunofluorescence images for KRT19 (green) and DAPI (blue) of images of tumor organoids and their matched primary tumors. (c) SOX9 (red) and GATA6 (green) staining in primary tumors and tumor organoids. (d) H&E images of primary patient tumor and matched tumor organoids. (e) MTT assay readings of organoid cultures treated with gemcitabine for 4 days. Results were normalized to vehicle-treated organoids. (f) MTT assay readings of organoid cultures with gemcitabine and epigenetic inhibitor of the H3K27me3 writer EZH2 (UNC1999). Results were normalized to vehicle-treated organoids. (g) MTT reading of tumor organoids treated with UNC199 alone. Results were normalized to vehicle-treated organoids. See online methods for details. (h) Immunostaining for H3K27me3 (green) and histone H3 (red) in two primary patient tumors (top panel) and corresponding tumor organoids (bottom panel). (i) Basal O2 consumption rate as measured by Seahorse™ flux analyzer with and without UNC1999 treatment. (j) GLUT1 (red) expression in primary tumors and tumor organoids derived from tumor UHN6 and UHN17. KRT19 (green) and DAPI (blue). For MTT and oxygen consumptions experiments, data represent mean +/− S.D. P value (t-test, two tailed): N.S-, not significant; *P= 0.01 – 0.05; **P= 0.001 – 0.01; ***P= < 0.001 (N= 3 technical repeats). All scale bars equal to 50 µm.

References

    1. Ghaneh P, Costello E, Neoptolemos JP. Biology and management of pancreatic cancer. Postgraduate Medical Journal. 2008;84:478–497. - PubMed
    1. Kanji ZS, Gallinger S. Diagnosis and management of pancreatic cancer. CMAJ. 2013;185:1219–1226. - PMC - PubMed
    1. Vincent A, Herman J, Schulick R, Hruban RH, Goggins M. Pancreatic cancer. Lancet. 2011;378:607–620. - PMC - PubMed
    1. Agbunag C, Lee KE, Buontempo S, Bar-Sagi D. Pancreatic duct epithelial cell isolation and cultivation in two-dimensional and three-dimensional culture systems. Methods in enzymology. 2006;407:703–710. - PubMed
    1. Huch M, et al. Unlimited in vitro expansion of adult bi-potent pancreas progenitors through the Lgr5/R-spondin axis. The EMBO journal. 2013;32:2708–2721. - PMC - PubMed

Methods References

    1. Nostro MC, et al. Stage-specific signaling through TGFbeta family members and WNT regulates patterning and pancreatic specification of human pluripotent stem cells. Development. 2011;138:861–871. - PMC - PubMed
    1. Nostro MC, et al. Efficient generation of NKX6-1+ pancreatic progenitors from multiple human pluripotent stem cell lines. Stem Cell Report. 2015;4:591–604. - PMC - PubMed

Publication types

MeSH terms