. 2016 Feb;11(2):191-7.
doi: 10.1038/nnano.2015.243. Epub 2015 Oct 26.

Macromolecular crowding creates heterogeneous environments of gene expression in picolitre droplets

Affiliations

Macromolecular crowding creates heterogeneous environments of gene expression in picolitre droplets

Maike M K Hansen et al. Nat Nanotechnol. 2016 Feb.

Abstract

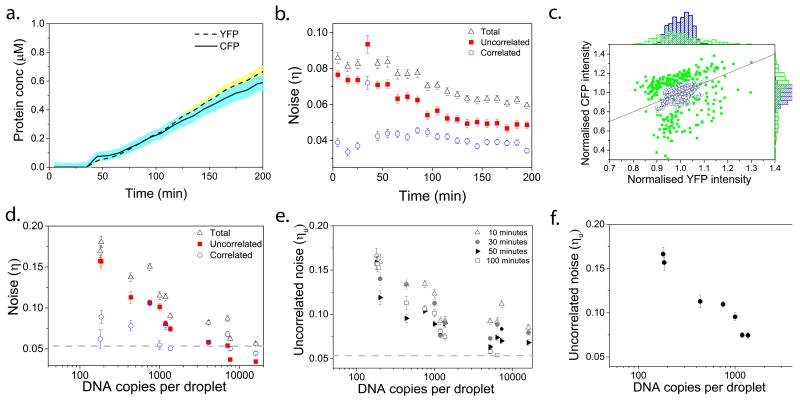
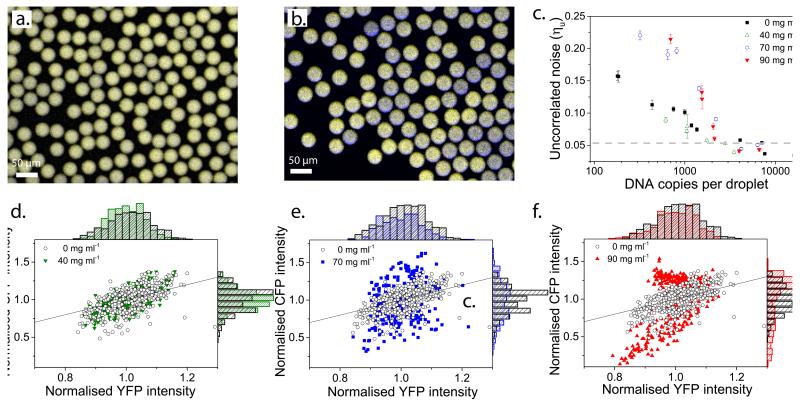
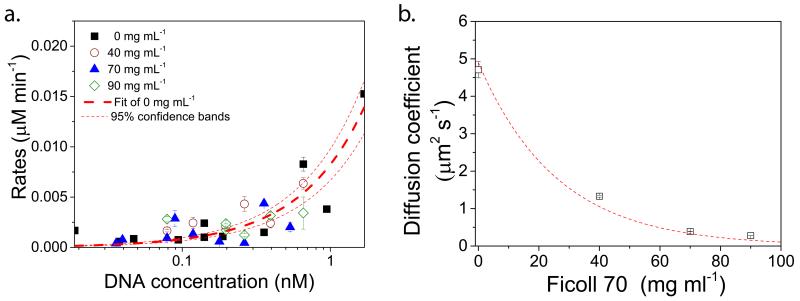
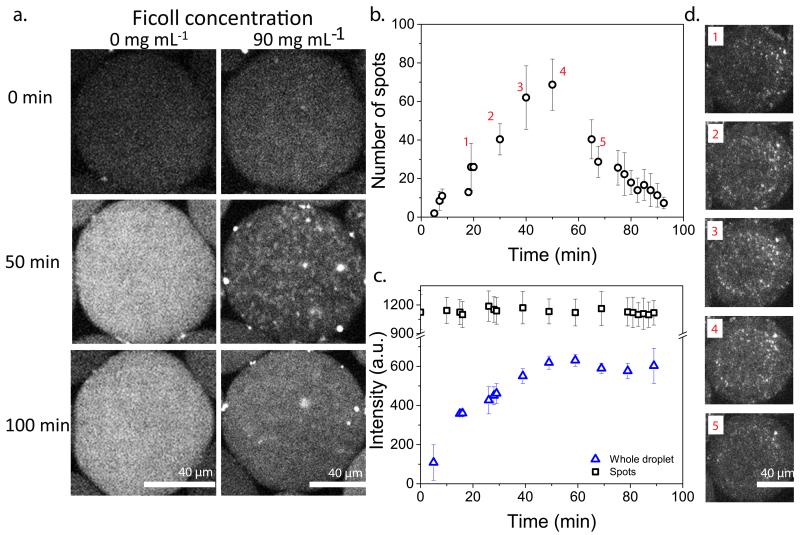
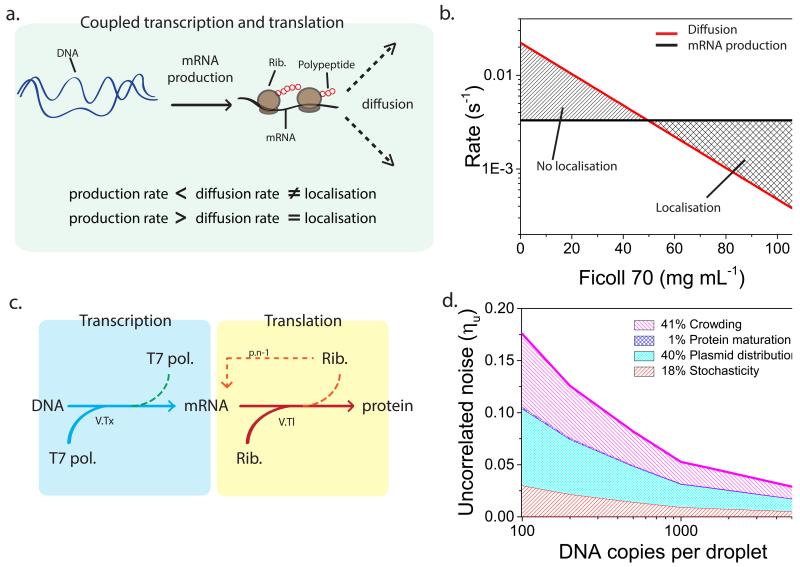
Understanding the dynamics of complex enzymatic reactions in highly crowded small volumes is crucial for the development of synthetic minimal cells. Compartmentalized biochemical reactions in cell-sized containers exhibit a degree of randomness due to the small number of molecules involved. However, it is unknown how the physical environment contributes to the stochastic nature of multistep enzymatic processes. Here, we present a robust method to quantify gene expression noise in vitro using droplet microfluidics. We study the changes in stochasticity in the cell-free gene expression of two genes compartmentalized within droplets as a function of DNA copy number and macromolecular crowding. We find that decreased diffusion caused by a crowded environment leads to the spontaneous formation of heterogeneous microenvironments of mRNA as local production rates exceed the diffusion rates of macromolecules. This heterogeneity leads to a higher probability of the molecular machinery staying in the same microenvironment, directly increasing the system's stochasticity.


Figures

Figure 1
Figure 1. Correlated versus uncorrelated noise
a, Correlated noise is dominated by the Poisson distribution of reactants over the population of droplets, causing differences of CFP and YFP levels between droplets, i.e. CFP and YFP levels within a droplet are correlated. b, Uncorrelated noise is the noise orthogonal to the line CFP=YFP. c, Uncorrelated noise is caused by relative differences in the Poisson distributions of plasmids, stochasticity of the biochemical reactions, differences in the maturation time of CFP and YFP and the effect of a crowded environment with limited diffusion.
Figure 2
Figure 2. Effect of decreased copy number on inherent stochasticity of gene expression in pico-reactors
a, Average CFP and YFP expression over all droplets. b, Uncorrelated (red full squares), correlated (blue empty circles) and total noise (black empty triangles) values over time for 7600 copies of each plasmid per droplet. c, Normalised CFP versus normalised YFP intensities of the whole population of droplets at 100 minutes after the start of fluorescence increase for 190 (green full squares), and 16,000 copies (blue empty circles) of each plasmid per droplet. Each point represents one droplet. The line is the axis X = Y. d, Uncorrelated (red full squares), correlated (blue empty circles) and total noise (black empty triangles) at 100 minutes after start of fluorescence increase for a range of DNA concentrations. The dotted line represents the background noise due to imaging and analysis (Supplementary Fig. 6). e, Uncorrelated noise values for the DNA range at 10 (empty triangles), 30 (full circles), 50 (full triangles) and 100 (empty squares) minutes after start of fluorescence increase. f, Uncorrelated noise values for the DNA range at different time points where the total protein concentration had reached 0.2 μM. d-f, Error bars show 95% confidence intervals, which were calculated by bootstrapping from the original distribution.
Figure 3
Figure 3. Enhancement of uncorrelated noise in the presence of Ficoll
a, Superimposed false colour images; CFP and YFP levels are similar in dilute droplets, approximately 600 copies of each plasmid per droplet. b, Super-imposed false colour images; CFP and YFP levels show high variability over a population of droplets, due to differences in CFP and YFP expression within the same droplet at 90 mg ml−1 of Ficoll, approximately 600 copies of each plasmid per droplet. c, Uncorrelated noise at 100 minutes after start of expression for a range of DNA concentrations at different Ficoll concentrations, 0 mg ml−1 (black full squares), 40 mg ml−1 (green empty triangles), 70 mg ml−1 (blue empty circles) and 90 mg ml−1 (red full triangles). The dotted line represents the background noise due to imaging and analysis (Supplementary Fig. 6) and error bars show 95% confidence intervals, which were calculated by bootstrapping from the original distribution. d-f, Normalised CFP versus normalised YFP intensities of the whole population of droplets at 100 minutes after the start of expression, 0 mg ml−1 Ficoll (black empty circles) and 40 mg ml−1 Ficoll (green full triangles), 70 mg ml−1 Ficoll (blue full squares), 90 mg ml−1 Ficoll (red full triangles), for approximately 600 copies of plasmid per droplet. Each point represents one droplet.
Figure 4
Figure 4. Protein expression rates and ribosomal diffusion coefficients
a, CFP expression rates for 0, 40, 70 and 90 mg mL−1 with linear fit for 0 mg mL−1 showing 95% confidence bands. b, Diffusion coefficients of ribosomes over a range of Ficoll concentrations determined using fluorescence recovery after photo bleaching experiments. The dashed line is a Stokes-Einstein fit of the diffusion coefficient D ~ 1/μ, with μ the concentration-dependent dynamic viscosity of Ficoll (Supplementary methods).
Figure 5
Figure 5. Inhomogeneous distribution of mRNA over one droplet at high Ficoll concentrations
a, In vitro transcription only experiments with 0.6 nM pET-32×BT showing mRNA expression with 0 mg mL−1 (left) and 90 mg mL−1 (right) of Ficoll, in the presence of molecular beacon (MB) b, Average number of spots over time from three separate droplets (circles) with error bars showing standard deviations. c, Average fluorescence intensity over time of the detected spots (squares) and the whole droplets (triangles). Error bars are standard deviations of three separate droplets. d, Representative fluorescence images corresponding to the labelled time points in b.
Figure 6
Figure 6. Theoretical modelling of gene expression noise
a, During in vitro transcription and translation all the biologically active machinery is unlikely to localise at the production site if the production rate is smaller than the diffusion rate, and is likely to localise at the production site if the production rate is larger than diffusion rate. b, Theoretical model predictions of mRNA production (black line) and polysome diffusion over half the average distance between two plasmids (red line). The crossover between both rates indicates the transition between a homogeneous distribution of mRNA and an overall localization of mRNA, therefore showing the Ficoll concentrations at which we would see localisation and which not. c, Schematic illustration of the stochastic transcription-translation model used in crowded droplets. Due to the formation of microenvironments ribosomes preferentially rebind to previous mRNA (n-1). d, Simulation results showing the contributions of all factors to the total uncorrelated noise. Stochasticity shown in red, plasmid distribution in light blue, protein maturation in dark blue, and crowding in violet.

References

    1. Maamar H, Raj A, Dubnau D. Noise in Gene Expression Determines Cell Fate in Bacillus subtilis. Science. 2007;317:526–529. - PMC - PubMed
    1. Chang HH, Hemberg M, Barahona M, Ingber DE, Huang S. Transcriptome-wide noise controls lineage choice in mammalian progenitor cells. Nature. 2008;453:544–547. - PMC - PubMed
    1. Graf T, Stadtfeld M. Heterogeneity of Embryonic and Adult Stem Cells. Cell Stem Cell. 2008;3:480–483. - PubMed
    1. Gupta Piyush B., et al. Stochastic State Transitions Give Rise to Phenotypic Equilibrium in Populations of Cancer Cells. Cell. 2011;146:633–644. - PubMed
    1. Weinberger LS, Burnett JC, Toettcher JE, Arkin AP, Schaffer DV. Stochastic Gene Expression in a Lentiviral Positive-Feedback Loop: HIV-1 Tat Fluctuations Drive Phenotypic Diversity. Cell. 2005;122:169–182. - PubMed

Publication types

MeSH terms