. 2015 Dec;2(1):8.
doi: 10.1186/s40658-015-0112-5. Epub 2015 Mar 11.

Dental artifacts in the head and neck region: implications for Dixon-based attenuation correction in PET/MR

Affiliations

Dental artifacts in the head and neck region: implications for Dixon-based attenuation correction in PET/MR

Claes N Ladefoged et al. EJNMMI Phys. 2015 Dec.

Abstract

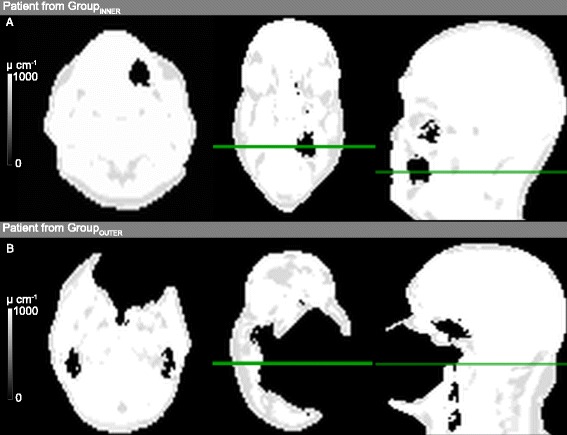
Background: In the absence of CT or traditional transmission sources in combined clinical positron emission tomography/magnetic resonance (PET/MR) systems, MR images are used for MR-based attenuation correction (MR-AC). The susceptibility effects due to metal implants challenge MR-AC in the neck region of patients with dental implants. The purpose of this study was to assess the frequency and magnitude of subsequent PET image distortions following MR-AC.

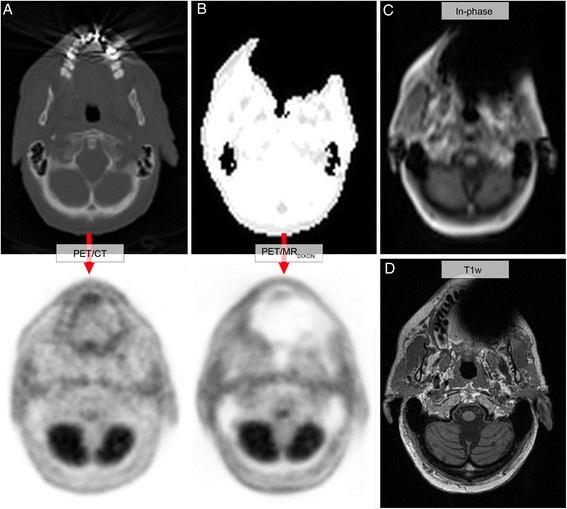
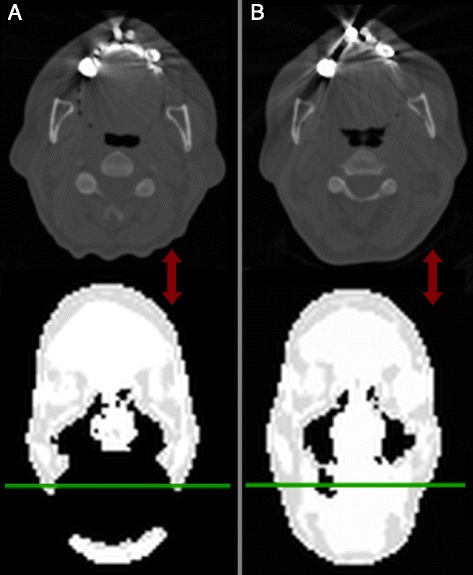
Methods: A total of 148 PET/MR patients with clear visual signal voids on the attenuation map in the dental region were included in this study. Patients were injected with [(18)F]-FDG, [(11)C]-PiB, [(18)F]-FET, or [(64)Cu]-DOTATATE. The PET/MR data were acquired over a single-bed position of 25.8 cm covering the head and neck. MR-AC was based on either standard MR-ACDIXON or MR-ACINPAINTED where the susceptibility-induced signal voids were substituted with soft tissue information. Our inpainting algorithm delineates the outer contour of signal voids breaching the anatomical volume using the non-attenuation-corrected PET image and classifies the inner air regions based on an aligned template of likely dental artifact areas. The reconstructed PET images were evaluated visually and quantitatively using regions of interests in reference regions. The volume of the artifacts and the computed relative differences in mean and max standardized uptake value (SUV) between the two PET images are reported.

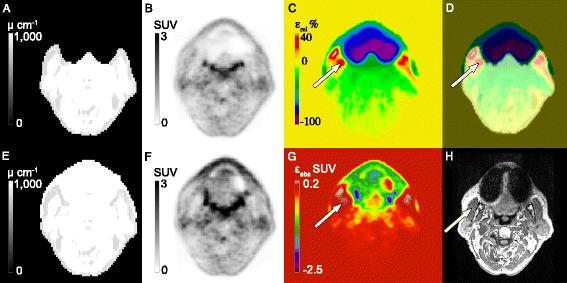
Results: The MR-based volume of the susceptibility-induced signal voids on the MR-AC attenuation maps was between 1.6 and 520.8 mL. The corresponding/resulting bias of the reconstructed tracer distribution was localized mainly in the area of the signal void. The mean and maximum SUVs averaged across all patients increased after inpainting by 52% (± 11%) and 28% (± 11%), respectively, in the corrected region. SUV underestimation decreased with the distance to the signal void and correlated with the volume of the susceptibility artifact on the MR-AC attenuation map.

Conclusions: Metallic dental work may cause severe MR signal voids. The resulting PET/MR artifacts may exceed the actual volume of the dental fillings. The subsequent bias in PET is severe in regions in and near the signal voids and may affect the conspicuity of lesions in the mandibular region.

Keywords: Attenuation correction; Inpainting; Metal artifacts; PET/MRI; Quantification.


Figures

Figure 1
Figure 1
Separation of patients by semi-automatic investigations of the connected neighborhoods for each artifact. (A) Patient from GroupINNER where the artifact is fully enclosed by the anatomical surface. (B) Patient from GroupOUTER where the artifact breaches the anatomical surface and is artificially connected to the background. From left to right: transaxial view, coronal view and sagittal view of MR-ACDIXON attenuation maps.
Figure 2
Figure 2
Workflow of algorithm. (1) The boundary is found and closed for the patients in GroupOUTER by the use of the NAC-PET image and MR-ACDIXON. (2) For both groups, the patients' Dixon-water image is aligned to an atlas, and the air regions within the anatomical surface and overlapping with the mask drawn on the atlas will be filled. The resulting image is denoted MR-ACINPAINTED.
Figure 3
Figure 3
Transaxial views of a patient from Group OUTER with dental fillings. (A) CT and CT-AC-PET (/CT) image. (B) MR-based attenuation map and MR-AC-PET (/MR) image. (C) In-phase image from Dixon sequence. (D) T1w MR image.
Figure 4
Figure 4
Representative patients from Group INNER (A-D) and Group OUTER (E-H). Note the recovery of tracer activity in the proximity of the artifact when comparing (F) to (G). Panels (D,H) show the corresponding relative PET difference images for (A,B) in relation to (B) and (E-F) to (F), respectively.
Figure 5
Figure 5
Relative percent difference between the PET images. (A) Fully inpainted region. (B) Lower tongue. (C) Tongue. (D) Masticatory muscles. (E) Cerebellum. Note the reduced scales on (D) and (E). Patient numbering is random within the groups.
Figure 6
Figure 6
Volume and relative percentage difference on x - and y -axes. Relative percentage difference shown for the fully inpainted area. (A) patients from GroupINNER, (B) patients from GroupOUTER.
Figure 7
Figure 7
Images from PET/MR of a patient (Group OUTER ) with large positive bias in regions just outside the artifact. (A) Original attenuation map. (E) Attenuation map after inpainting. (B,F) corresponding PET images following MR-AC. Note the recovery of PET signal in the dental region. (C) The mean relative difference image (ε rel) for (B-F) in relation to (F). (G) Absolute difference image (ε abs) for (B) to (F). Note the positive SUV region in the masticatory muscles. (D) A and C fused. (H) T1w MR image. Arrows point to the masticatory muscle.
Figure 8
Figure 8
Effect of dental artifact on soft tissue lesion. Effect of dental artifact (GroupOUTER) on soft tissue lesion located to the left, caudally posteriorly in the body of the lingua Dixon (A) and inpainted (B) with anatomical in top row and PET image in bottom row. Measurements in lesion: mean relative difference, −19%; max relative difference, −18%; mean absolute difference, −1; max absolute difference, −1.7.
Figure 9
Figure 9
Demonstration of the irreproducibility of the artifact sizes between scans. MR-AC (bottom row) compared to CT (upper row). (A,B) MR-ACDIXON and CT images of the same patient acquired 4 months apart. Note that the magnitude and size of CT artifacts seem unchanged between the scans.

References

    1. Hillner BE, Siegel BA, Liu D, Shields AF, Gareen IF, Hanna L, et al. Impact of positron emission tomography/computed tomography and positron emission tomography (PET) alone on expected management of patients with cancer: initial results from the National Oncologic PET Registry. J Clin Oncol. 2008;26:2155–61. doi: 10.1200/JCO.2007.14.5631. - DOI - PubMed
    1. Beyer T, Townsend DW, Czernin J, Freudenberg LS. The future of hybrid imaging-part 2: PET/CT. Insights Imaging. 2011;2:225–34. doi: 10.1007/s13244-011-0069-4. - DOI - PMC - PubMed
    1. Kinahan PE, Townsend DW, Beyer T, Sashin D. Attenuation correction for a combined 3D PET/CT scanner. Med Phys. 1998;25:2046. doi: 10.1118/1.598392. - DOI - PubMed
    1. Bockisch B, Beyer T, Antoch G, Freudenberg LS, Kühl H, Debatin JF, Müller SP, et al. Positron emission tomography/computed tomography imaging protocols, artifacts, and pitfalls. Mol Imaging Biol. 2004;6:188–99. doi: 10.1016/j.mibio.2004.04.006. - DOI - PubMed
    1. Pichler BJ, Kolb A, Nägele T, Schlemmer HP. PET/MRI: paving the way for the next generation of clinical multimodality imaging applications. J Nucl Med. 2010;51:333–6. doi: 10.2967/jnumed.109.061853. - DOI - PubMed

LinkOut - more resources