

Performance evaluation of the Biograph mCT Flow PET/CT system according to the NEMA NU2-2012 standard
- PMID: 26501827
- PMCID: PMC4883615
- DOI: 10.1186/s40658-015-0132-1
Performance evaluation of the Biograph mCT Flow PET/CT system according to the NEMA NU2-2012 standard
Abstract
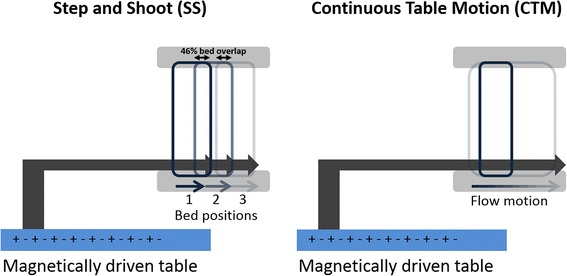
Background: The purpose of the study is to evaluate the physical performance of a Biograph mCT Flow 64-4R PET/CT system (Siemens Healthcare, Germany) and to compare clinical image quality in step-and-shoot (SS) and continuous table motion (CTM) acquisitions.
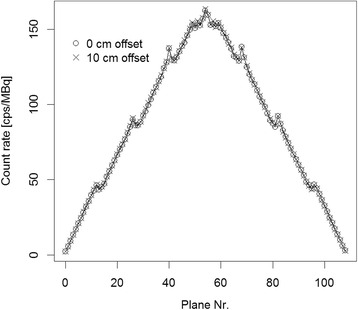
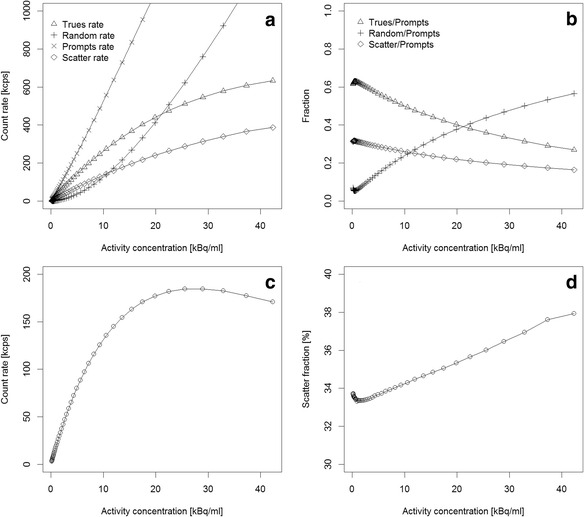
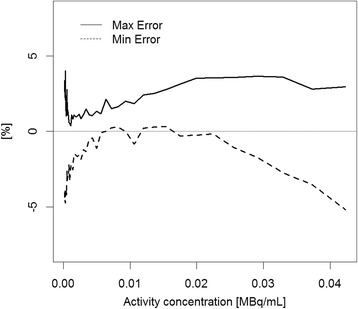
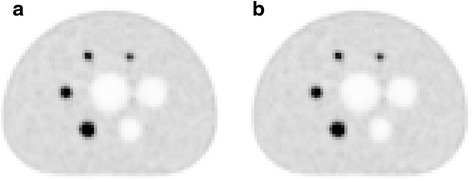
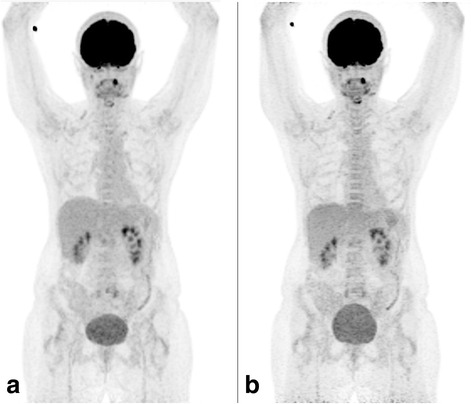
Methods: The spatial resolution, sensitivity, count rate curves, and Image Quality (IQ) parameters following the National Electrical Manufactures Association (NEMA) NU2-2012 standard were evaluated. For resolution measurements, an (18)F point source inside a glass capillary tube was used. Sensitivity measurements were based on a 70-cm-long polyethylene tube, filled with 4.5 MBq of FDG. Scatter fraction and count rates were measured using a 70-cm-long polyethylene cylinder with a diameter of 20 cm and a line source (1.04 GBq of FDG) inserted axially into the cylinder 4.5 cm off-centered. A NEMA IQ phantom containing six spheres (10- to 37-mm diameter) was used for the evaluation of the image quality. First, a single-bed scan was acquired (NEMA standard), followed by a two-bed scan (4 min each) of the IQ phantom with the image plane containing the spheres centered in the overlap region of the two bed positions. In addition, a scan of the same region in CTM mode was performed with a table speed of 0.6 mm/s. Furthermore, two patient scans were performed in CTM and SS mode. Image contrasts and patient images were compared between SS and CTM acquisitions.
Results: Full Width Half Maximum (FWHM) of the spatial resolution ranged from 4.3 to 7.8 mm (radial distance 1 to 20 cm). The measured sensitivity was 9.6 kcps/MBq, both at the center of the FOV and 10 cm off-center. The measured noise equivalent count rate (NECR) peak was 185 kcps at 29.0 kBq/ml. The scatter fraction was 33.5 %. Image contrast recovery values (sphere-to-background of 8:1) were between 42 % (10-mm sphere) to 79 % (37-mm sphere). The background variability was between 2.1 and 5.3 % (SS) and between 2.4 and 6.9 % (CTM). No significant difference in image quality was observed between SS and CTM mode.
Conclusions: The spatial resolution, sensitivity, scatter fraction, and count rates were in concordance with the published values for the predecessor system, the Biograph mCT. Contrast recovery values as well as image quality obtained in SS and CTM acquisition modes were similar.
Keywords: Biograph mCT Flow; Image quality; NEMA evaluation.
Figures
References
-
- Beyer T, Townsend DW, Brun T, Kinahan PE, Charron M, Roddy R, Jerin J, Young J, Byars L, Nutt R. A combined PET/CT tomograph for clinical oncology. J Nucl Med. 2000;41(8):1369–79. - PubMed
-
- Melcher CL. Scintillator crystals for PET. J Nucl Med. 2000;41:1051–1055. - PubMed
-
- Moses W. Time of flight in PET revisited. IEEE Trans Nucl Sci. 2003;50(5):1325–1330. doi: 10.1109/TNS.2003.817319. - DOI
-
- Surti S, Kuhn A, Werner ME, Perkins AE, Kolthammer J, Karp JS. Performance of Philips Gemini TF PET/CT scanner with special consideration for its time-of-flight imaging capabilities. J Nucl Med. 2007;48(3):471–480. - PubMed
LinkOut - more resources
Full Text Sources
Other Literature Sources
