. 2015 Nov;33(11):1173-81.
doi: 10.1038/nbt.3388. Epub 2015 Oct 26.

A comparison of genetically matched cell lines reveals the equivalence of human iPSCs and ESCs

Affiliations

A comparison of genetically matched cell lines reveals the equivalence of human iPSCs and ESCs

Jiho Choi et al. Nat Biotechnol. 2015 Nov.

Abstract

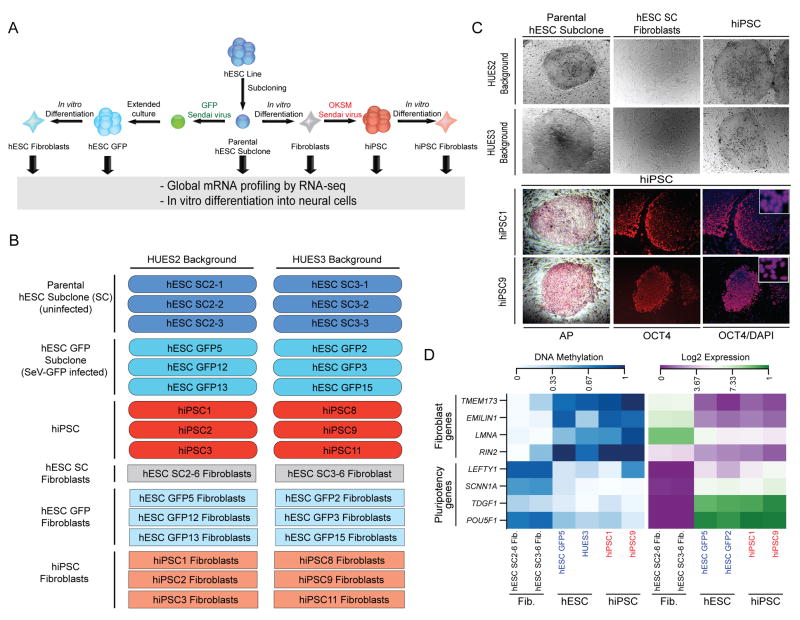
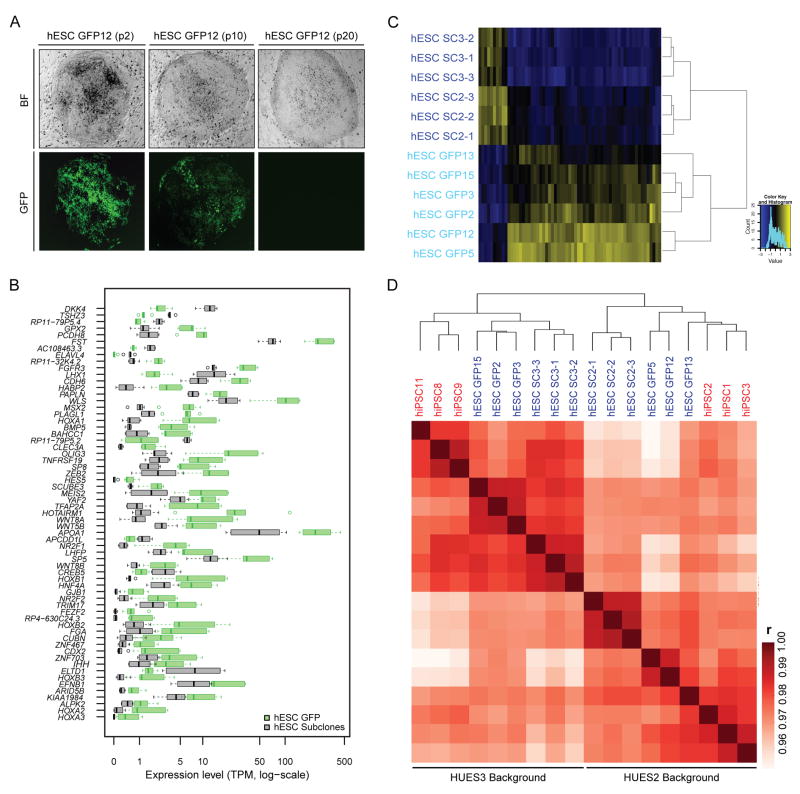
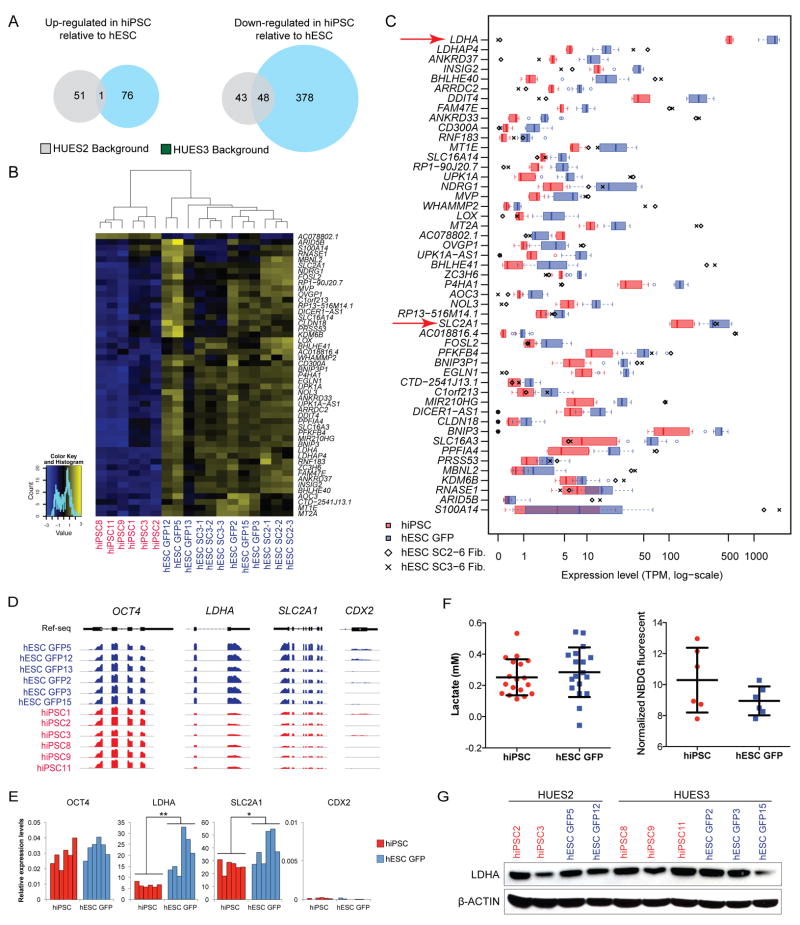
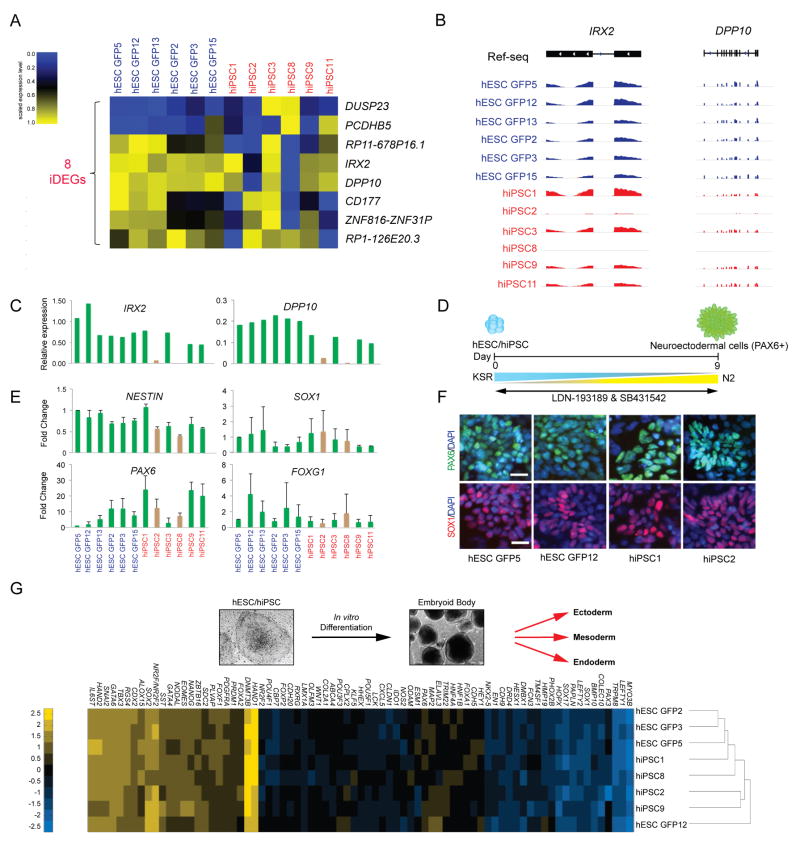
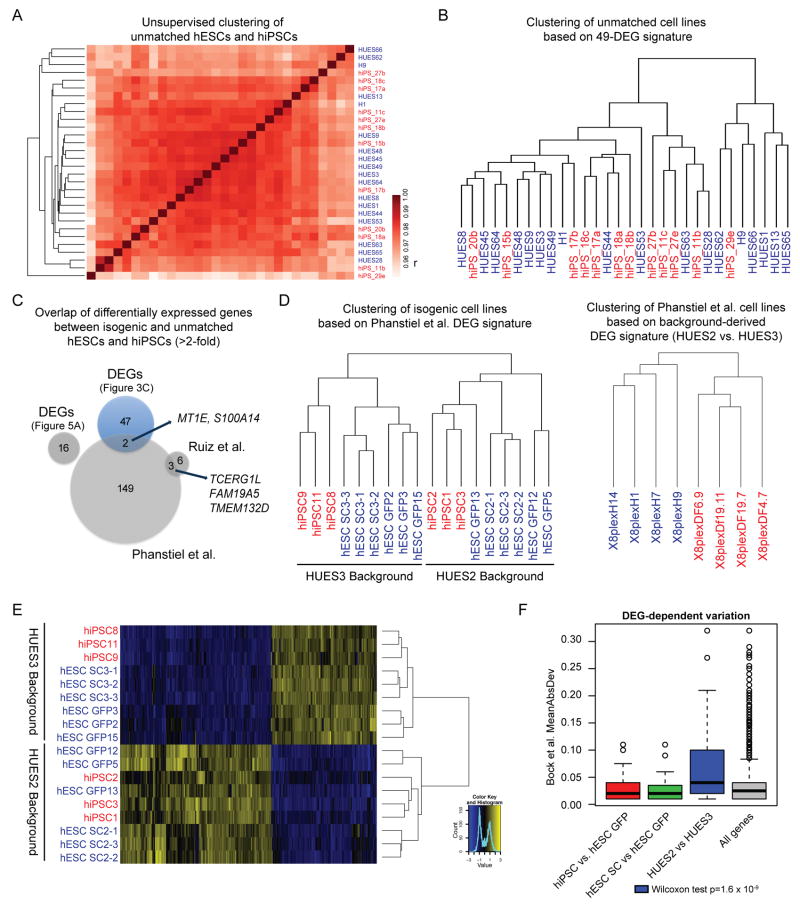
The equivalence of human induced pluripotent stem cells (hiPSCs) and human embryonic stem cells (hESCs) remains controversial. Here we use genetically matched hESC and hiPSC lines to assess the contribution of cellular origin (hESC vs. hiPSC), the Sendai virus (SeV) reprogramming method and genetic background to transcriptional and DNA methylation patterns while controlling for cell line clonality and sex. We find that transcriptional and epigenetic variation originating from genetic background dominates over variation due to cellular origin or SeV infection. Moreover, the 49 differentially expressed genes we detect between genetically matched hESCs and hiPSCs neither predict functional outcome nor distinguish an independently derived, larger set of unmatched hESC and hiPSC lines. We conclude that hESCs and hiPSCs are molecularly and functionally equivalent and cannot be distinguished by a consistent gene expression signature. Our data further imply that genetic background variation is a major confounding factor for transcriptional and epigenetic comparisons of pluripotent cell lines, explaining some of the previously observed differences between genetically unmatched hESCs and hiPSCs.


Figures

Figure 1
Figure 1. Generation of genetically matched hESCs and hiPSCs
(A) Schematic for the generation of genetically matched hESC and hiPSC lines. (B) Overview of HUES2 and HUES3 derivatives used for RNA-sequencing. (C) Top panel shows bright images of hESC subclones, in vitro-differentiated fibroblasts, whereas the bottom panel shows hiPSC lines stained for alkaline phosphatase activity or OCT4 expression. Co-staining with DAPI confirmed nuclear expression of OCT4 (inset). (D) Heatmaps depicting DNA methylation (left) and gene expression (right) levels of key fibroblast-associated and pluripotency-associated genes in isogenic hESCs, in vitro-differentiated fibroblasts and derivative hiPSCs.
Figure 2
Figure 2. Influence of viral infection and genetic background on transcriptional patterns in isogenic hESCs and hiPSCs
(A) Representative bright field (top) and fluorescence (bottom) images of the hESC GFP12 line at passage 2, 10, and 20 after SeV-GFP infection. (B) Expression levels of 63 genes that were identified to be significantly different between 3 biological replicates of hESC GFP and 3 biological replicates of hESC SC lines within each of the two genetic backgrounds (FDR<0.01 and fold change >2 or <0.5; see details in the Methods section). Green and grey boxes indicate the expression ranges for each differentially regulated gene in 6 hESC GFP and 6 hESC SC lines, respectively. TPM; transcripts per million. (C) Heatmap and dendrogram separating all isogenic hESC lines based on the 63 DEGs shown from Fig. 2B. hESC SC lines, dark blue; hESC GFP lines, light blue. (D) Heatmap and dendrogram for all isogenic hESC and hiPSC lines based on pairwise Pearson correlation (r) of global gene expression levels (log-scaled). hiPSC lines, red; hESC lines, blue.
Figure 3
Figure 3. Differentially expressed genes (DEGs) between isogenic hESC and hiPSC lines
(a) Venn diagram showing the number of genes consistently up- or down- regulated in 3 biological replicate hiPSC lines when compared to 3 biological replicate hESC GFP lines from the same genetic background. (FDR<0.01 and fold change <2 or <1/2, see details in the Methods section). (B) Heatmap and dendrogram for all isogenic hESC and hiPSC lines based on the 49 differentially expressed genes (DEGs) that were common between the HUES2 and HUES3 backgrounds, using hierarchical clustering based on row-scaled expression levels. hiPSC lines, red; hESC lines, blue. (C) Box plot of 6 hESC GFP lines, 6 hiPSC lines, and parental fibroblasts for the 49 DEGs. Red and blue boxes indicate the expression ranges of each gene in hiPSC and hESC GFP lines, respectively. Diamonds and crosses indicate the expression levels of each gene in parental fibroblasts derived from HUES2 and HUES3 backgrounds, respectively. Genes are ordered by Student’s t-test p-value between the 6 hiPSC and 6 hESC GFP lines. Red arrows depict genes discussed in main text. (D) RNA-seq read density of hESC GFP and hiPSC lines for OCT4, LDHA, SLC2A1, and CDX2. (E) Expression levels of OCT4, LDHA, SLC2A1, and CDX2 by qPCR in hESC GFP and hiPSC lines, normalized to ACTB (n=6). Student’s t-test *, p<0.05; **, p<0.01. Mean ± s.d. (F) Lactate production levels (left) and glucose uptake levels (right) of hESC GFP (blue) and hiPSC lines (red). Shown are data from three biological replicates for lactate assay (6 technical replicates) and from six biological replicates for glucose uptake assay (p>0.05 for both assays). Mean ± s.d. (G) Representative Western blot for LDHA levels in hESC GFP (blue) and hiPSC (red) lines.
Figure 4
Figure 4. Dysregulation of genes in a subset of hiPSC lines
(A) Heatmap of the 8 inconsistently differentially expressed genes (iDEGs) for all isogenic hESCs and hiPSC lines (as defined in Supplementary Fig. 3C) within each of the two genetic backgrounds at FDR<0.01 and fold change <2 or <0.5. hiPSC lines, red; hESC lines, blue. (B) Genome browser images of IRX2 and DPP10 RNA-seq reads in hESC GFP and hiPSC lines. (C) Expression levels of IRX2 and DPP10 by qPCR in each hESC GFP and hiPSC line, normalized to ACTB. Brown bars indicate hiPSC lines that have undergone aberrant silencing of IRX2 and DPP10. (D) Schematic for neural induction using the combination of SB431542, an ALK inhibitor, and LDN-193189, a BMP inhibitor. (E) Fold change of the neural markers NESTIN, SOX1, PAX6, and FOXG1 by qPCR in hESC GFP and hiPSC lines relative to the hESC GFP5 line. Brown bars indicate the hiPSC lines that have undergone transcriptional silencing of IRX2 and DPP10. Results are shown from three independent experiments. Mean ± s.d. (F) Immunofluorescence staining of PAX6 (green) and SOX1 (red) indicates neural differentiation at day 6 in hESC GFP and hiPSC lines. DAPI (blue). (G) Scorecard assay of embryoid bodies (EBs) derived from isogenic hESC and hiPSC lines. Heatmap and dendrogram for these EBs based on the expression levels of the indicated developmental genes.
Figure 5
Figure 5. Analysis of previously reported gene expression differences and role of genetic background
(A) Dendrogram and heatmap for unmatched hESC (blue) and hiPSC (red) lines based on pairwise Pearson correlation (r) on global gene expression levels (log- scaled). (B) Dendrogram based on the 49 DEGs identified using isogenic lines in Fig. 3C for all unmatched hESC (blue) and hiPSC (red) lines. Note the lack of clustering. (D) Venn diagram of differentially expressed genes between hESCs and hiPSCs identified in this study and previous reports utilizing unmatched hESCs and hiPSCs. Overlapping genes between DEGs from independent reprogramming studies are indicated by arrows. (D) Dendrogram of isogenic hESC and hiPSC lines using the differentially expressed genes identified by Phanstiel et al. (left panel) and dendrogram of hESC and hiPSC lines from Phanstiel et al. using HUES2 vs. HUES3-specific DEGs as discussed in the main text (right). hiPSC lines, red; hESC lines, blue. (E) Dendrogram and heatmap of isogenic hESC (blue) and hiPSC (red) lines based on HUES2 vs. HUES3-specific DEGs. (F) Transcriptional variation of different gene sets across unmatched hESC and hiPSC lines reported by Bock et al. Boxplots show mean absolute deviation (MAD) among hiPSCs and hESCs when considering indicated DEG sets. Note that HUES2 vs HUES3-specific DEGs show the greatest variation. A one-tailed Wilcoxon ranksum test was performed between each set of DEGs and all genes.

Comment in

References

    1. Takahashi KK, Yamanaka SS. Induction of pluripotent stem cells from mouse embryonic and adult fibroblast cultures by defined factors. Cell. 2006;126:663–676. - PubMed
    1. Takahashi K, et al. Induction of pluripotent stem cells from adult human fibroblasts by defined factors. Cell. 2007;131:861–872. - PubMed
    1. Park I-H, et al. Disease-specific induced pluripotent stem cells. Cell. 2008;134:877–886. - PMC - PubMed
    1. Yu J, et al. Induced Pluripotent Stem Cell Lines Derived from Human Somatic Cells. Science. 2007;318:1917–1920. - PubMed
    1. Chin MH, et al. Induced Pluripotent Stem Cells and Embryonic Stem Cells Are Distinguished by Gene Expression Signatures. Cell Stem Cell. 2009;5:111–123. - PMC - PubMed

Publication types