

Electrophysiology and Perception of Speech in Noise in Older Listeners: Effects of Hearing Impairment and Age
- PMID: 26502191
- PMCID: PMC4621778
- DOI: 10.1097/AUD.0000000000000191
Electrophysiology and Perception of Speech in Noise in Older Listeners: Effects of Hearing Impairment and Age
Abstract
Objectives: Speech perception in background noise is difficult for many individuals, and there is considerable performance variability across listeners. The combination of physiological and behavioral measures may help to understand sources of this variability for individuals and groups and prove useful clinically with hard-to-test populations. The purpose of this study was threefold: (1) determine the effect of signal-to-noise ratio (SNR) and signal level on cortical auditory evoked potentials (CAEPs) and sentence-level perception in older normal-hearing (ONH) and older hearing-impaired (OHI) individuals, (2) determine the effects of hearing impairment and age on CAEPs and perception, and (3) explore how well CAEPs correlate with and predict speech perception in noise.
Design: Two groups of older participants (15 ONH and 15 OHI) were tested using speech-in-noise stimuli to measure CAEPs and sentence-level perception of speech. The syllable /ba/, used to evoke CAEPs, and sentences were presented in speech-spectrum background noise at four signal levels (50, 60, 70, and 80 dB SPL) and up to seven SNRs (-10, -5, 0, 5, 15, 25, and 35 dB). These data were compared between groups to reveal the hearing impairment effect and then combined with previously published data for 15 young normal-hearing individuals to determine the aging effect.
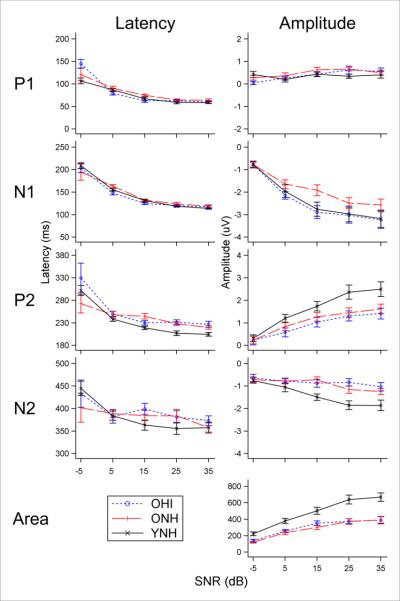
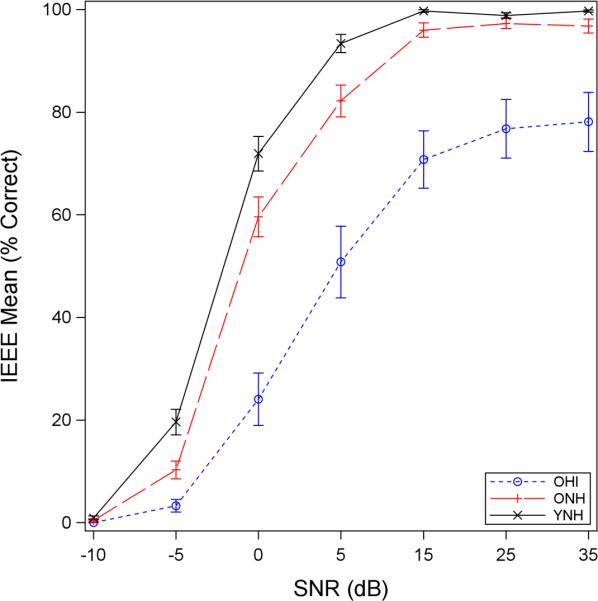
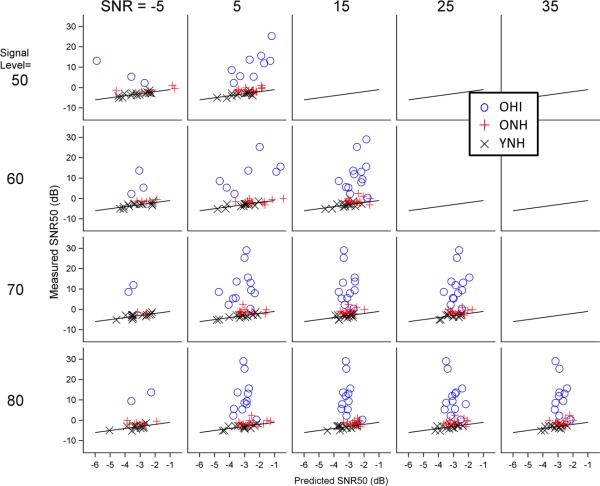
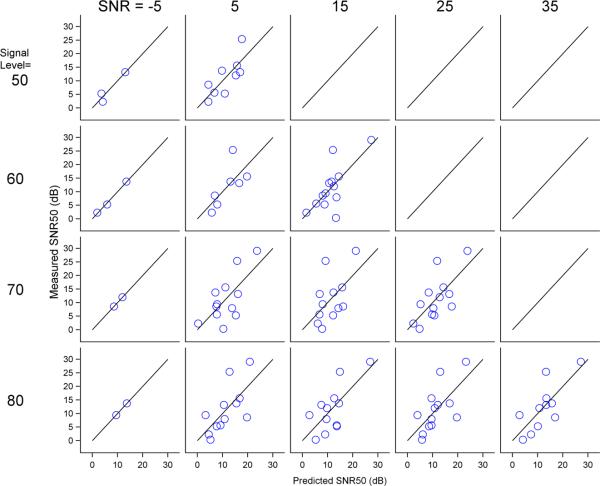
Results: Robust effects of SNR were found for perception and CAEPs. Small but significant effects of signal level were found for perception, primarily at poor SNRs and high signal levels, and in some limited instances for CAEPs. Significant effects of age were seen for both CAEPs and perception, while hearing impairment effects were only found with perception measures. CAEPs correlate well with perception and can predict SNR50s to within 2 dB for ONH. However, prediction error is much larger for OHI and varies widely (from 6 to 12 dB) depending on the model that was used for prediction.
Conclusions: When background noise is present, SNR dominates both perception-in-noise testing and cortical electrophysiological testing, with smaller and sometimes significant contributions from signal level. A mismatch between behavioral and electrophysiological results was found (hearing impairment effects were primarily only seen for behavioral data), illustrating the possible contributions of higher order cognitive processes on behavior. It is interesting that the hearing impairment effect size was more than five times larger than the aging effect size for CAEPs and perception. Sentence-level perception can be predicted well in normal-hearing individuals; however, additional research is needed to explore improved prediction methods for older individuals with hearing impairment.
Figures

Similar articles
-
The Effect of Signal to Noise Ratio on Cortical Auditory-Evoked Potentials Elicited to Speech Stimuli in Infants and Adults With Normal Hearing.Ear Hear. 2018 Mar/Apr;39(2):305-317. doi: 10.1097/AUD.0000000000000487. Ear Hear. 2018. PMID: 28863034
-
Word recognition for temporally and spectrally distorted materials: the effects of age and hearing loss.Ear Hear. 2012 May-Jun;33(3):349-66. doi: 10.1097/AUD.0b013e318242571c. Ear Hear. 2012. PMID: 22343546
-
Cortical Auditory Evoked Potentials Recorded From Nucleus Hybrid Cochlear Implant Users.Ear Hear. 2015 Nov-Dec;36(6):723-32. doi: 10.1097/AUD.0000000000000206. Ear Hear. 2015. PMID: 26295607 Free PMC article.
-
Assessment of auditory discrimination in hearing-impaired patients.Eur Ann Otorhinolaryngol Head Neck Dis. 2018 Oct;135(5):335-339. doi: 10.1016/j.anorl.2018.04.004. Epub 2018 Apr 30. Eur Ann Otorhinolaryngol Head Neck Dis. 2018. PMID: 29709388 Review.
-
A perspective on brain-behavior relationships and effects of age and hearing using speech-in-noise stimuli.Hear Res. 2018 Nov;369:90-102. doi: 10.1016/j.heares.2018.03.024. Epub 2018 Mar 31. Hear Res. 2018. PMID: 29661615 Free PMC article. Review.
Cited by
-
Cortical signal-in-noise coding varies by noise type, signal-to-noise ratio, age, and hearing status.Neurosci Lett. 2017 Jan 1;636:258-264. doi: 10.1016/j.neulet.2016.11.020. Epub 2016 Nov 9. Neurosci Lett. 2017. PMID: 27838448 Free PMC article.
-
Age Effects on Neural Representation and Perception of Silence Duration Cues in Speech.J Speech Lang Hear Res. 2019 Apr 26;62(4S):1099-1116. doi: 10.1044/2018_JSLHR-H-ASCC7-18-0076. J Speech Lang Hear Res. 2019. PMID: 31026197 Free PMC article.
-
Application of Linear Mixed-Effects Models in Human Neuroscience Research: A Comparison with Pearson Correlation in Two Auditory Electrophysiology Studies.Brain Sci. 2017 Feb 27;7(3):26. doi: 10.3390/brainsci7030026. Brain Sci. 2017. PMID: 28264422 Free PMC article.
-
Age-Related Compensation Mechanism Revealed in the Cortical Representation of Degraded Speech.J Assoc Res Otolaryngol. 2020 Aug;21(4):373-391. doi: 10.1007/s10162-020-00753-4. Epub 2020 Jul 8. J Assoc Res Otolaryngol. 2020. PMID: 32643075 Free PMC article.
-
Phoneme and Word Scoring in Speech-in-Noise Audiometry.Am J Audiol. 2016 Mar;25(1):75-83. doi: 10.1044/2016_AJA-15-0068. Am J Audiol. 2016. PMID: 26989823 Free PMC article.
References
-
- Agung K, Purdy SC, McMahon CM, et al. The use of cortical auditory evoked potentials to evaluate neural encoding of speech sounds in adults. J Am Acad Audiol. 2006;17(8):559–572. - PubMed
-
- Alain C, Woods DL, Covarrubias D. Activation of duration-sensitive auditory cortical fields in humans. Electroencephalogr Clin Neurophysiol. 1997;104(6):531–539. - PubMed
-
- Androulidakis AG, Jones SJ. Detection of signals in modulated and unmodulated noise observed using auditory evoked potentials. Clin Neurophysiol. 2006;117:1783–1793. - PubMed
Publication types
MeSH terms
Grants and funding
LinkOut - more resources
Full Text Sources
Medical
Miscellaneous
