A Region-of-Interest Approach for Detecting Progression of Glaucomatous Damage With Optical Coherence Tomography
- PMID: 26502216
- PMCID: PMC5253178
- DOI: 10.1001/jamaophthalmol.2015.3871
A Region-of-Interest Approach for Detecting Progression of Glaucomatous Damage With Optical Coherence Tomography
Erratum in
-
Error in Byline.JAMA Ophthalmol. 2016 Apr;134(4):469. doi: 10.1001/jamaophthalmol.2016.0422. JAMA Ophthalmol. 2016. PMID: 26967811 No abstract available.
Abstract
Importance: Detecting progression of glaucomatous damage is often challenging.
Objective: To test the feasibility of using frequency-domain optical coherence tomography (FD-OCT) and a region-of-interest (ROI) approach to measure progressive changes in glaucomatous damage.
Design, setting, and participants: Among a group of patients in an institutional glaucoma practice who were likely to show glaucoma progression, eyes with a history of an optic disc hemorrhage (DH) confirmed by stereophotography were followed up with FD-OCT cube scans of the optic disc. All patients underwent FD-OCT scans on at least 2 occasions separated by at least 1 year (mean, 3.45 years; range, 1.42-6.39 years). Because we were not studying the effects of an optic DH, no constraint was placed on the time between the documentation of an optic DH and the first scan used in the analysis.
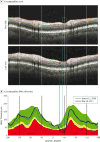
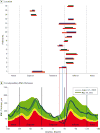
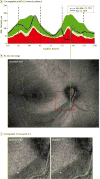
Main outcomes and measures: After en face images of the FD-OCT scan were aligned based on the blood vessels, circumpapillary images were derived for an annulus 100 µm in width, and the retinal nerve fiber layer (RNFL) thickness profiles were plotted for the first and last visits. The ROI width associated with the optic DH was defined as the region of the RNFL profile below the 1% CI based on healthy norms. The change in the ROI width was compared with the change in the global RNFL thickness, which was obtained by averaging the circumpapillary RNFL thickness.
Results: The change in the ROI width (mean [SD], 8.0° [6.4°]; 95% CI, 4.9° to 11.1°; range, -0.7° to 19.3°) was significant (P < .001, 2-tailed t test) while the change in the global thickness (mean [SD], 2.40 [5.87] μm; 95% CI, -0.48 to 5.28 μm) was not significant (P > .12, 2-tailed t test). Although 15 of the 16 ROIs increased in width between visits, only 11 showed a decrease in the global RNFL thickness.
Conclusions and relevance: For detecting progression of local RNFL damage in patients with glaucoma, an OCT ROI approach appears superior to the OCT global RNFL thickness measure typically used.
Conflict of interest statement
Disclosures: All authors have completed and submitted the ICMJE Form for Disclosure of Potential Conflicts of Interest. Dr Hood reported receiving equipment and grant funding from Topcon and reported receiving equipment from Heidelberg Engineering. No other disclosures were reported.
Figures


References
-
- Leung CK. Diagnosing glaucoma progression with optical coherence tomography. Curr Opin Ophthalmol. 2014;25(2):104–111. - PubMed
-
- Leung CK, Yu M, Weinreb RN, Lai G, Xu G, Lam DS. Retinal nerve fiber layer imaging with spectral-domain optical coherence tomography: patterns of retinal nerve fiber layer progression. Ophthalmology. 2012;119(9):1858–1866. - PubMed
-
- Kim JM, Kyung H, Azarbod P, Lee JM, Caprioli J. Disc haemorrhage is associated with the fast component, but not the slow component, of visual field decay rate in glaucoma. Br J Ophthalmol. 2014;98(11):1555–1559. - PubMed
Publication types
MeSH terms
Grants and funding
LinkOut - more resources
Full Text Sources
Other Literature Sources
Medical
Research Materials

