. 2015 Dec;18(12):1737-45.
doi: 10.1038/nn.4146. Epub 2015 Oct 26.

GDF10 is a signal for axonal sprouting and functional recovery after stroke

Affiliations

GDF10 is a signal for axonal sprouting and functional recovery after stroke

Songlin Li et al. Nat Neurosci. 2015 Dec.

Abstract

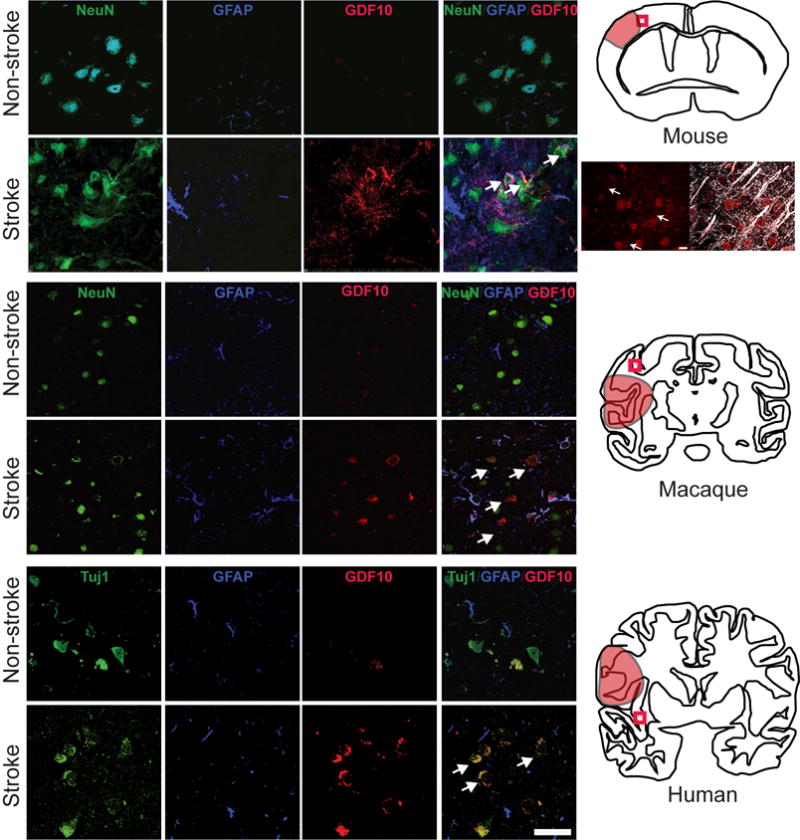
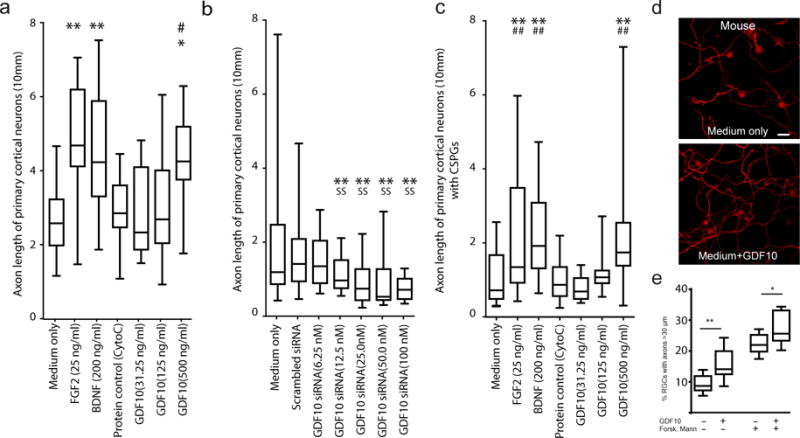
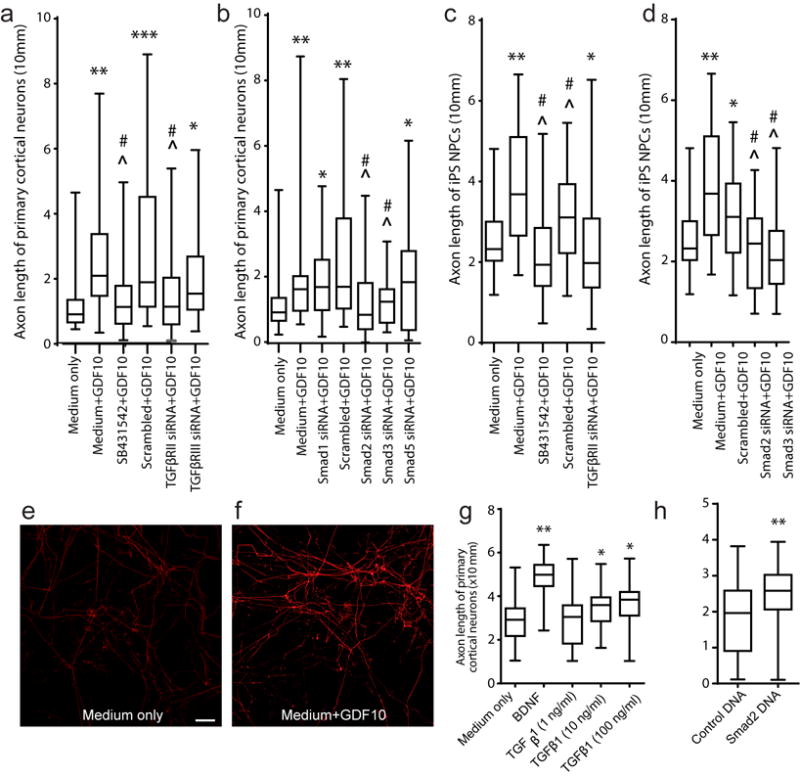
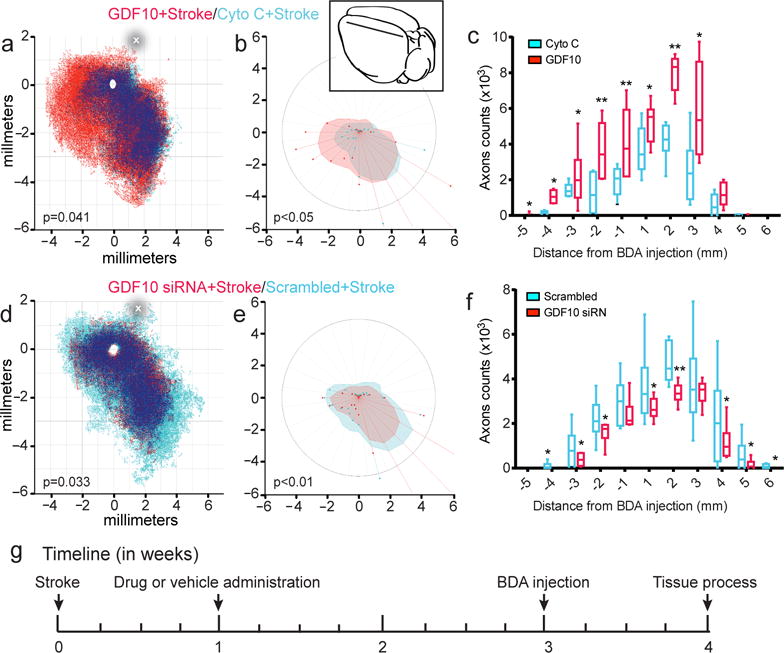
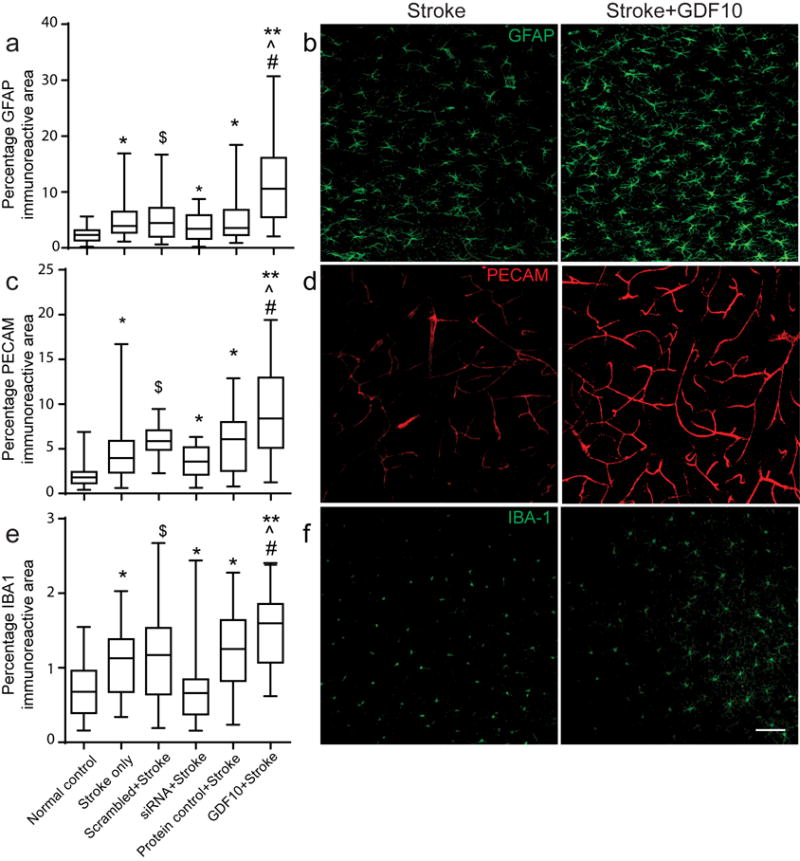
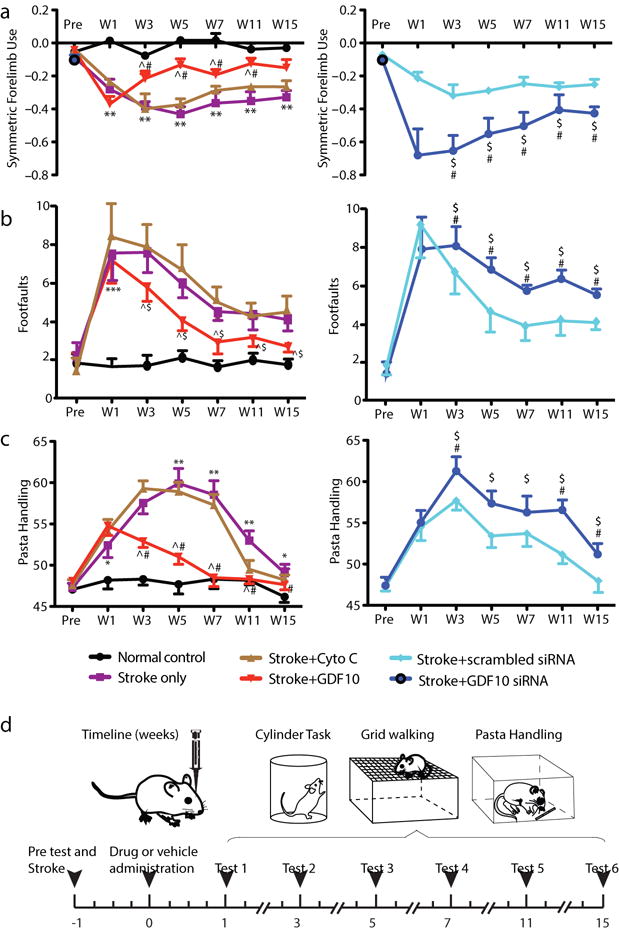
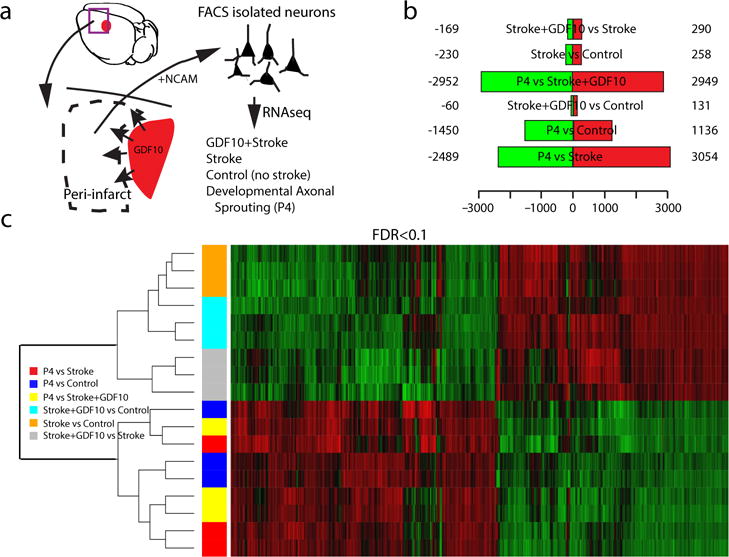
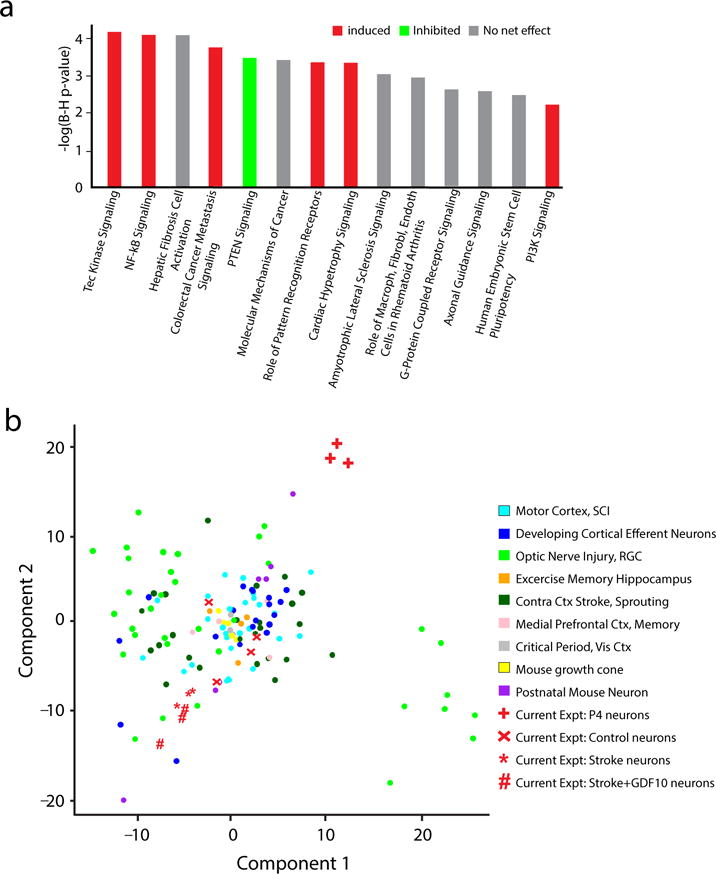
Stroke produces a limited process of neural repair. Axonal sprouting in cortex adjacent to the infarct is part of this recovery process, but the signal that initiates axonal sprouting is not known. Growth and differentiation factor 10 (GDF10) is induced in peri-infarct neurons in mice, non-human primates and humans. GDF10 promotes axonal outgrowth in vitro in mouse, rat and human neurons through TGFβRI and TGFβRII signaling. Using pharmacogenetic gain- and loss-of-function studies, we found that GDF10 produced axonal sprouting and enhanced functional recovery after stroke; knocking down GDF10 blocked axonal sprouting and reduced recovery. RNA sequencing from peri-infarct cortical neurons revealed that GDF10 downregulated PTEN, upregulated PI3 kinase signaling and induced specific axonal guidance molecules. Using unsupervised genome-wide association analysis of the GDF10 transcriptome, we found that it was not related to neurodevelopment, but may partially overlap with other CNS injury patterns. Thus, GDF10 is a stroke-induced signal for axonal sprouting and functional recovery.


Conflict of interest statement

COMPETING FINANCIAL INTERESTS

The authors declare no competing financial interests.

Figures

Figure 1
Figure 1
GDF10 expression in peri-infarct cortex after stroke in mice, macaques and humans. Top section shows immunohistochemical staining in peri-infarct cortex in mice 7 days after stroke (n=5). GD10 staining (red) is apparent in peri-infarct tissue, overlapping with NeuN staining (green). Arrows in bottom right panel show representative NeuN+/GDF10+ cells. Schematic at right shows location of stroke as red shaded area; box is position of photomicrographs. The panels below the mouse schematic are higher magnification of GDF10 (red) co-localizing to neurons whose dendrites are MAP2+ (white), denoted by arrows. Middle section shows immunohistochemical staining in peri-infarct cortex in non-human primate (n = 2 stroke, n = 3 control) 2 days after stroke. Same conventions as in mouse panels. Arrows in bottom right show double labeled NeuN+/GDF10+ neurons after stroke. Bottom section shows mmunohistochemical staining in human control (n = 4) and stroke (n = 7). Arrows show double labeled NeuN+/GDF10+ neurons after stroke. In this human case the stroke is chronic, or greater than 3 months after the event. Scale bar = 50 μm and applies to all photomicrographs.
Figure 2
Figure 2
GDF10 enhances axonal outgrowth in primary neurons in vitro. (a–c) Axonal outgrowth in P4 mouse primary cortical neurons. Axon length was measured after 3 days in culture. Cyto C = cytochrome C, a protein control for the addition of growth factor, used in the in vivo studies (Fig. 4a). In (c), wells are plated with CSPG prior to cell growth. In all graphs box extends from the 25th to 75th percentiles and the line in the box is the mean. The whiskers show the minimum and maximum values. (d) P4 cortical neurons stained with SMI-312 after 2 additional days culture in medium alone or medium+GDF10 (500 ηg/ml). Scale bar = 20 μm. (e) Rat adult RGCs cultured in presence of GDF10, forskolin or mannitol. n=7 in culture medium only; n=8 the other 3 groups. Two independent cultures per condition and in each culture 4 wells repeating the condition. * = P<0.05, ** = P<0.01, compared to Medium only; ˆ = P<0.05 compared to Medium+GDF10; # = P<0.05, ## = P<0.01 compared to Scrambled+GDF10; @ = P<0.05, @@ = P<0.01 compared to Protein control Cyto C. All conditions were tested in quadruplicate, in two separate experiments. In (a) F (6, 105) = 7.220; (b) F (6, 105) = 8.384; (c) F (6, 105) = 22.44; (e) medium vs GDF10: t=2.852 df=13; fosk/mann vs fosk/man GDF10:t=2.371 df=14. Error bars are SEM. All observations are normalized to the number of NeuN positive cells in each sample (Supplementary Figure 12). Statistical testing is repeated-measures ANOVA followed by Tukey-Kramer’s post hoc test (a–c) or one tail unpaired T test (e).
Figure 3
Figure 3
GDF10 enhances axonal outgrowth in human neurons via TGFβ signaling. (a, b) P4 mouse cortical neuron culture with TβRI/II and Smad blockade. SB431542 is a TGFβRI antagonist, added at initial plating. In all graphs, box extends from the 25th to 75th percentiles and the line in the box is the mean. The whiskers show the minimum and maximum values (c, d) human iPS-neurons cultured in the presence of GDF10, SB431542, or TβRII, Smad2 and Smad3 siRNA. Each condition is 2–4 observations in 2–3 independent experiments. (e,f) iPS-NPCs in culture with GDF10 for 2 days, stained with SMI-312 for axons. Scale bar = 20 μm. (g) TGFβ1 and smad2 enhance axonal outgrowth of P4 primary cortical neurons. Axon length with treatment of TGFβ1 at ascending concentrations. N=3 for each experiment. (h) Axonal outgrowth with transfection of Smad2 expression plasmid. Conventions as in (g). * =P<0.05, ** =P<0.01, *** = P<0.005 compared to Medium only; ˆ = P<0.05 compared to Medium+GDF10; # = P<0.05, ## = P<0.01 compared to Scrambled+GDF10; @ = P<0.05, @@ = P<0.01 compared to Protein control Cyto C. All conditions were tested in quadruplicate, in two separate experiments. In (a) F (5, 186) = 10.28; (b) F (2, 93) = 6.138; (c) F (4, 155) = 10.23; (d) F (4, 155) = 11.49; (g) F (2, 93) = 4.435; (h) t test, two-tailed t = 3.073 df = 62. Error bars are SEM. All observations are normalized to the number of NeuN positive cells in each sample (Supplementary Figure 12). Statistical testing is repeated-measures ANOVA followed by Tukey-Kramer’s post hoc test (a–d,g) or one tail unpaired T test (h).
Figure 4
Figure 4
GDF10 promotes axonal connections in peri-infarct cortex after stroke. (a) Quantitative cortical mapping of connections in layers II/III of the flattened mouse cortical hemisphere ipsilateral to the forelimb motor cortex in stroke with protein control (Cyto C) (blue, n=8), GDF10+Stroke (red, n=8), and areas of dense overlap of these two conditions (dark blue). X and Y axes are distances in millimeters from the center of the BDA tracer injection (empty circle). P value is Hotellings T2. The horizontal line shows the position in which neuronal label was quantified within the ipsilateral hemisphere (c). (b) Polar plot of connections of forelimb motor cortex projections relative to the tracer injection in forelimb motor cortex as the origin. Filled polygons represent the 70th percentile of the distances of all BDA labeled connections from the injection site in each segment of the graph. Weighted polar vectors represent the median vector multiplied by the median of the normal distribution of the number of points in a given segment of the graph. P value is Watson’s nonparametric two-sample U2 test. (c) Projections from forelimb motor cortex after stroke with GDF10 delivery (red) and protein control (Cyto C) (red) taken from counts along the line in (a). * = P<0.05, **=P<0.01. Inset shows schematic mouse brain with the location of the BDA injection (black dot) and the linear quantification construct (line). In (c) and (f) box extends from the 25th to 75th percentiles and the line in the box is the mean. The whiskers show the minimum and maximum values. (d) Quantitative cortical mapping of GDF10 knockdown in stroke. Same conventions as in (a). (e) Polar plots of GDF10 siRNA and scrambled siRNA after stroke with same conventions as in (b). (f) Linear quantification of neuronal connections in treatment groups of GDF10 siRNA+Stroke and scrambled siRNA+Stroke. Same conventions as in (c)._In (c) F (1, 10) = 12.03; (f) F (1, 10) = 20.24. In (b) U2647.176, df 90939, df2 180911; (e) U2 78.616, df 38554, df2 5906. Error bars are SEM. The circle in (a) and (d) indicates the center of the stroke site.
Figure 5
Figure 5
Astrocyte, endothelial and inflammatory responses in peri-infarct cortex with GDF10 after stroke. All data are 28 days after stroke. (a) GFAP immunoreactivity is increased in all stroke conditions compared to control (* = p< 0.05, ** = p<0.01 vs. control, ˆ, # = p< 0.05 vs. stroke only, stroke+protein control, respectively) and significantly decreased in GDF10 siRNA+stroke compared to the scrambled siRNA ($=p<0.05 vs scrambled siRNA+stroke). In (a,c,e) box extends from the 25th to 75th percentiles and the line in the box is the mean. The whiskers show the minimum and maximum values. (b) Photomicrographs of GFAP immunostaining in stroke and Stroke+GDF10. (c) PECAM/CD31 immunoreactivity for endothelial cells in control and gain and loss of function in GDF10 after stroke. Conventions as in (a). GDF10 induces an increase and GDF10 siRNA reduces a decrease in PECAM immunoreactive vessels in peri-infarct cortex after stroke. (d) PECAM staining in peri-infarct cortex in stroke and stroke+GDF10. (e,f) IBA-1 immunoreactivity for microglia/macrophages in peri-infarct cortex. Stroke increases the microglial staining in peri-infarct cortex. GDF10 knockdown significantly reduces ($ = p<0.05) the staining of microglia/macrophages compared to scrambled siRNA+stroke. ($ = p<0.05). However, there is a significant difference in IBA-1 immunoreactive signal between groups of GDF10+Stroke and cyto C+Stroke. Bar in (f)=50μm. See Supplementary Table 11 for sample size and ANOVA statistics.
Figure 6
Figure 6
GDF10 improves behavioral recovery after stroke. (a) Cylinder test of forelimb symmetry in exploratory rearing (n=7 all conditions in behavioral testing). Y axis shows bilaterally symmetric rearing as 0.0 and percent of left (unaffected) forelimb rearing as negative values. Left graph: Stroke causes a significant increase in the number of rears with the left forelimb. GDF10 treatment produces a significant recovery compared to stroke+vehicle (# = P<0.05) and stroke+cyto C (ˆ = P<0.05). Right graph: Stroke+GDF10 siRNA impairs the normal recovery seen in stroke+vehicle (# = p<0.01) and in stroke+scrambled siRNA ($ = P<0.05). (b) Gridwalking test of forelimb function in gait. Y axis is the number of footfaults of the forelimb contralateral to the stroke (right forelimb). Left graph: Stroke+GDF10 produces a significant recovery in forelimb function compared to stroke+cyto C (ˆ = P<0.05). Right graph: Stroke+GDF10 siRNA reduces the normal process of motor recovery after stroke (** = P<0.01, compared with stroke+vehicle) and impairs the forelimb function compared with stroke+scrambled siRNA ($ = P<0.05). (c) Pasta handling task after stroke. Y axis is the Y axis is the percentage of handling time using right forepaw relative to both paws. Delivery of GDF10 results in a significant recovery in forepaw use compared to delivery of protein control cyto C (ˆ = P<0.05). Injection of GDF10 siRNA complex significantly reduces right forepaw function compared to injection of the scrambled siRNA ($ = p<0.05). In (a) F (1.958, 11.75) = 22.07; (b) F (1.869, 11.21) = 10.70; (c) F (2.101, 12.61) = 9.382. Error bars are SEM. Statistics are multiple comparisons ANOVA followed by Tukey-Kramer’s post hoc test
Figure 7
Figure 7
GDF stroke transcriptome. Genes differentially regulated at false discovery rate (FDR)<0.1 analyzed for relationship across stroke conditions, developmental state and molecular pathway. (a) Schematic of experimental approach of neuron isolation and deep sequencing (n=3 sample for each condition of 2 pooled brains per sample) (b). Differences in gene expression among conditions. Red is upregulated and green is downregulated greater than 1.2 fold. (c) Heat map and unsupervised clustering of transcriptomes. Green is downregulated and red is upregulated. Differentially expressed genes were identifed using the Bioconductor package EdgeR which are then considered and ranked based on adjusted p-values (FDR) of < 0.1. For hierarchical cluster analysis the distances between clusters were computed using the complete linkage clustering method (R hclust function).
Figure 8
Figure 8
GDF10 canonical signaling pathways and genome-wide associations. (a) Top canonical pathways significantly regulated in Stroke+GDF10 vs Stroke. Y axis is inverse log of p value corrected for multiple comparisons in Benjamini-Hochberg (B–H) test. Significance is set to a B–H p<0.05 = -log(B–H p-value) of 1.3. Red is net upregulation of this genes in this pathway; green is net downregulation. Grey is mixed up or downregulation in pathway genes such that there is not net trend. (b) Genome wide associations of Stroke+GDF10 transcriptome to learning and memory, neurodevelopmental and CNS injury transcriptomes. Statistical testing was Fisher’s exact p value, Benjamini-Hochberg correction for multiple comparisons (a) and principle component analysis of 180 transcriptomes (Supplementary Figure 11).

Comment in

References

    1. Dancause N, Barbay S, Frost SB, Plautz EJ, Chen D, Zoubina EV, Stowe AM, Nudo RJ. Extensive cortical rewiring after brain injury. J Neurosci. 2005 Nov 2;25(44):10167–79. - PMC - PubMed
    1. Brown CE, Aminoltejari K, Erb H, Winship IR, Murphy TH. In vivo voltage-sensitive dye imaging in adult mice reveals that somatosensory maps lost to stroke are replaced over weeks by new structural and functional circuits with prolonged modes of activation within both the peri-infarct zone and distant sites. J Neurosci. 2009;29:1719–34. - PMC - PubMed
    1. Li S, Overman JJ, Katsman D, Kozlov SV, Donnelly CJ, Twiss JL, et al. An age-related sprouting transcriptome provides molecular control of axonal sprouting after stroke. Nat Neurosci. 2010;13:1496–504. - PMC - PubMed
    1. Overman JJ, Clarkson AN, Wanner IB, Overman WT, Eckstein I, Maguire JL, et al. A role for ephrin-A5 in axonal sprouting, recovery, and activity-dependent plast icity after stroke. Proc Natl Acad Sci U S A. 2012;33:1–22. - PMC - PubMed
    1. Favre I, Zeffiro TA, Detante O, Krainik A, Hommel M, Jaillard A. Upper limb recovery after stroke is associated with ipsilesional primary motor cortical activity: a meta-analysis. Stroke. 2014;45:1077–83. - PubMed

Publication types

Substances