. 2015 Dec;16(12):1282-91.
doi: 10.1038/ni.3299. Epub 2015 Oct 26.

Long non-coding RNA profiling of human lymphoid progenitor cells reveals transcriptional divergence of B cell and T cell lineages

Affiliations

Long non-coding RNA profiling of human lymphoid progenitor cells reveals transcriptional divergence of B cell and T cell lineages

David Casero et al. Nat Immunol. 2015 Dec.

Abstract

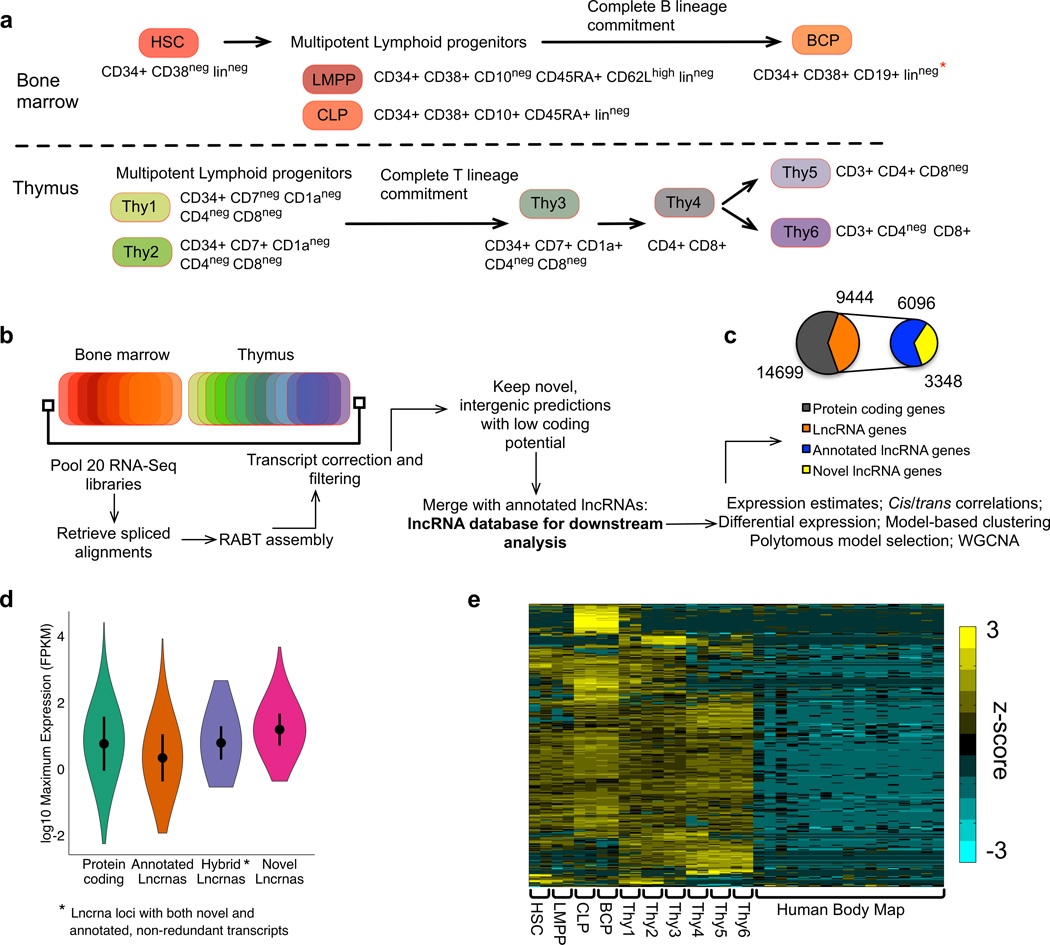
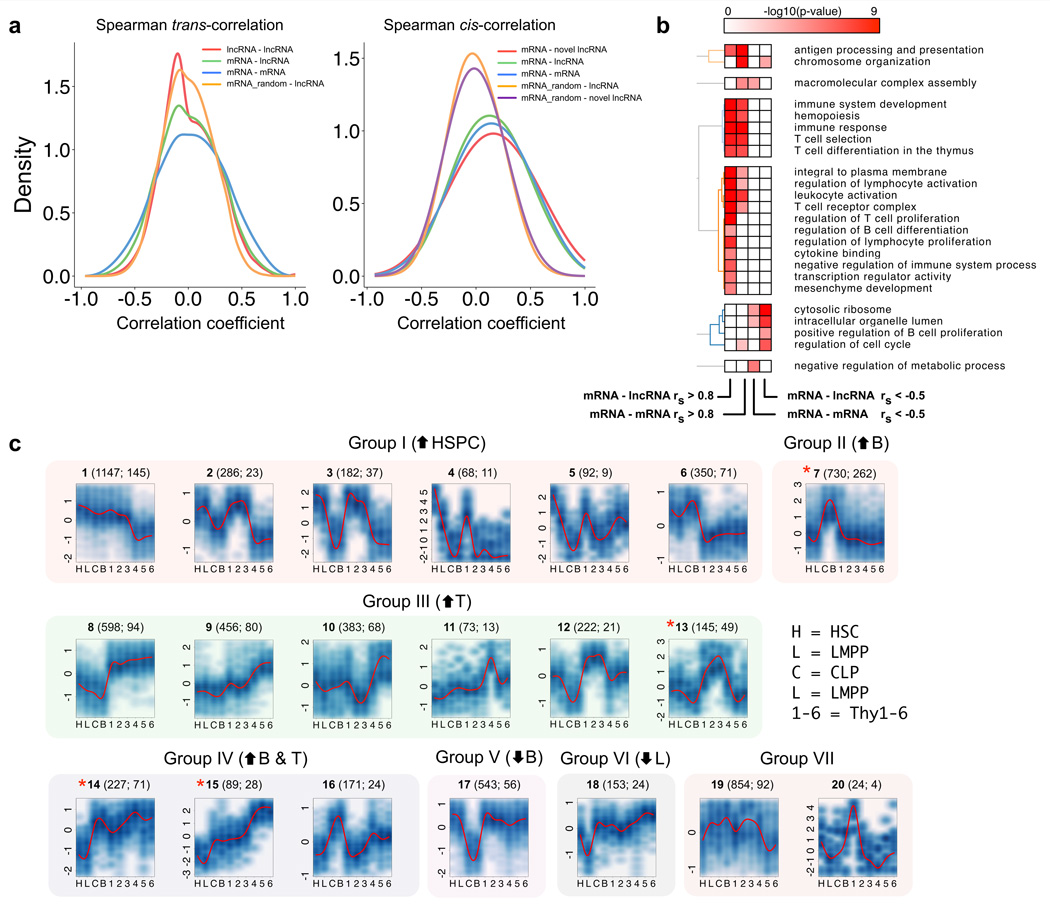
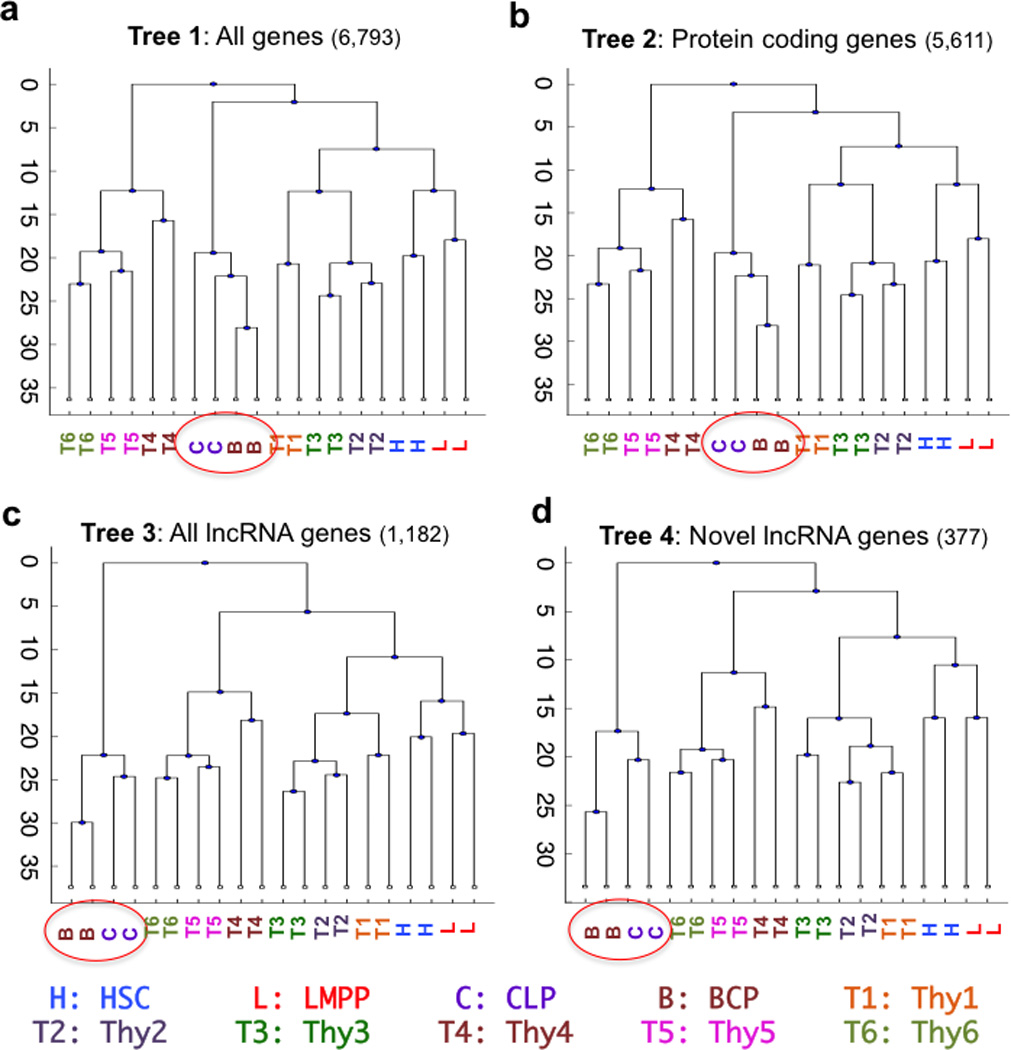
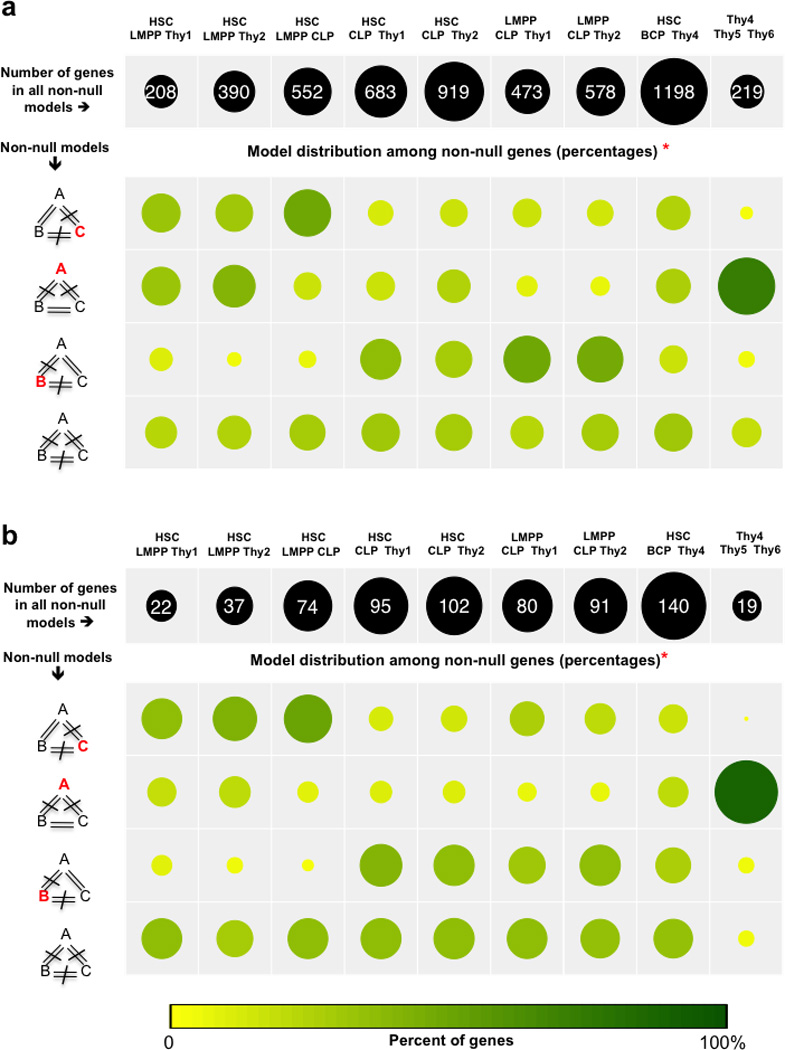
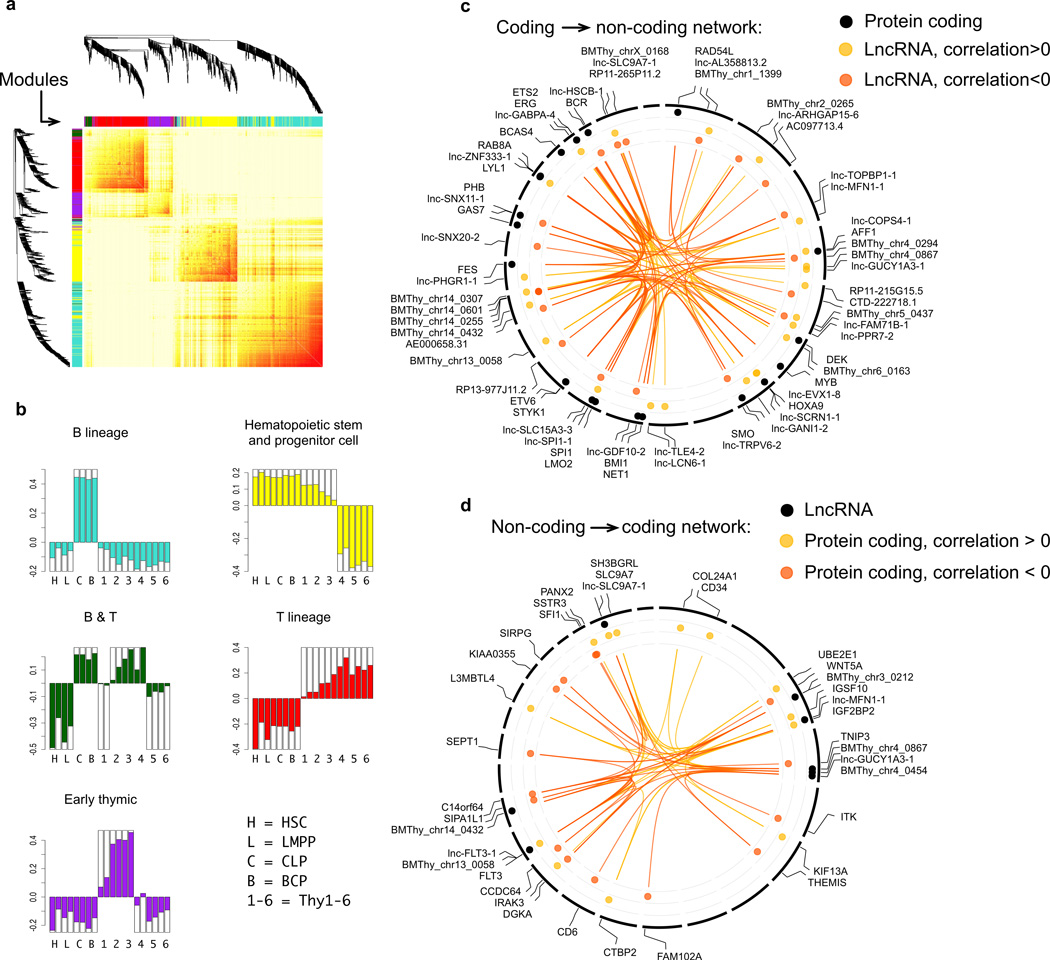
To elucidate the transcriptional 'landscape' that regulates human lymphoid commitment during postnatal life, we used RNA sequencing to assemble the long non-coding transcriptome across human bone marrow and thymic progenitor cells spanning the earliest stages of B lymphoid and T lymphoid specification. Over 3,000 genes encoding previously unknown long non-coding RNAs (lncRNAs) were revealed through the analysis of these rare populations. Lymphoid commitment was characterized by lncRNA expression patterns that were highly stage specific and were more lineage specific than those of protein-coding genes. Protein-coding genes co-expressed with neighboring lncRNA genes showed enrichment for ontologies related to lymphoid differentiation. The exquisite cell-type specificity of global lncRNA expression patterns independently revealed new developmental relationships among the earliest progenitor cells in the human bone marrow and thymus.


Figures

Figure 1
Figure 1. Human HSC and lymphoid transcriptomes are characterized by novel lncRNAs
(a) Schema of HSC and 9 lymphoid cell types in human bone marrow (BM) and thymus that were analyzed by RNA-Seq (n=20 samples [two biological replicates per population]). * Lineage cocktail included CD19 except in the case of BCP) (b) Bioinformatic analysis pipeline for annotating novel lncRNAs. (c) Number of expressed protein coding and long non-coding RNA genes (>1 FPKM in at least one sample). (d) Violin plot showing expression levels of protein coding and lncRNA genes (FPKM mean, standard deviation and range are depicted). For each gene the maximum expression value (of the 20 samples) was used to generate the plot. (e) Expression levels of novel lncRNA genes in BM and thymus samples, and 16 other cell types from the Human Body Map project (adipose, adrenal, breast, brain, colon, heart, kidney, leucocyte, liver, lung, lymph node, ovary, prostate, skeletal muscle, testis, thyroid, supplementary table 3). Shown are 357 genes differentially expressed in at least one pairwise comparison of the 10 populations. HSC-hematopoietic stem cell, LMPP-lymphoid primed multipotent progenitor, CLP-common lymphoid progenitor, BCP- B committed progenitor. “Annotated lncRNA genes” were defined as genes annotated in GencodeV19 and/or lncipedia databases. “Novel lncRNA genes” were defined as lncRNA genes that have not been annotated in these databases. Hybrid lncRNA genes represent a subset of annotated lncRNA genes for which we discovered novel transcripts.
Figure 2
Figure 2. LncRNAs transcription start sites (TSS) show cell type specific active chromatin profiles
(a) Histone modification profiles at TSSs of novel lncRNAs (ChiP-Seq data from hematopoietic stem and progenitor [CD133+] cells). (b) UCSC overlay tracks depicting representative novel lncRNAs overlapping histone modifications typically associated with enhancer (high H3K4Me1/ H3K4Me3 signal ratio) or promoter- (low H3K4Me1/ H3K4Me3 signal ratio) elements. Overlay tracks depict the normalized Chip-Seq signal for HSPC (CD34+ and CD133+), CD19+ primary cells, and thymic cells (color code not shown). (c) H3K4Me1/ H3K4Me3 signal intensity ratios for protein coding genes and novel lncRNAs for ChIP-Seq data from CD34+ mobilized peripheral blood cells, CD19+ primary B lymphocytes, and thymic cells. (d) ChIP-Seq metaplots (histone mark density) at TSSs of protein coding and lncRNA genes, stratified by gene expression level are depicted for CD34+ HSPC, CD19+ B lymphocytes, and unfractionated thymocytes; HSC, BCP, and Thy4 respectively represent the closest related cell types in the RNA-Seq dataset (see Supplementary Fig.3). “Highly expressed” was defined as the top 2,000 transcripts when all the transcripts are ranked by expression level in that cell type. Cell type “specific” transcripts were defined as those showing peak expression in that cell type, and the peak value exceeds twice the mean of the expression in all other cell types. Publically available ChIP-Seq datasets (Supplementary table 3) were used for the analysis of histone profiles.
Figure 3
Figure 3. LncRNA genes are co-expressed with protein coding genes involved in hematopoiesis and immune function, during lymphoid differentiation
(a) Density histograms of pairwise Spearman expression correlations between genes from different classes, in trans or cis. (b) Gene ontology enrichment for protein coding genes in cis and positively correlated with lncRNA genes (mRNA – lncRNA rs > 0.8), other protein coding genes (mRNA – mRNA rs > 0.8), or negatively correlated (mRNA – lncRNA rs < −0.5, mRNA – mRNA rs < −0.5). Colormap indicates the –log10 hypergeometric p value for enrichment as provided by DAVID functional annotation tools. (c) Model-based expression profiles (Profiles 1–20, Group I–VII) of differentially expressed genes (protein coding and lncRNA genes) during lymphoid differentiation. Numbers above each plot indicate: Profile identifier number (Total number of genes in the profile; number of lncRNA genes in the profile). Group VII contains profiles that could not be assigned to a specific differentiation related pattern. * Profiles enriched for lncRNA genes (p<0.05 when compared with the proportion of lncRNAs among all differe;ntially expressed genes). HSPC: hematopoietic stem/progenitor cells.
Figure 4
Figure 4. Lymphoid commitment and differentiation are characterized by stage and lineage specific global lncRNA expression patterns
Sample clustering analysis based on differentially expressed genes (fold change >2 and FDR<5% for at least one pairwise comparison of the ten cell types). (a) All genes (protein coding and lncRNA genes); (b) Protein coding genes; (c) All lncRNA genes; and (d) Novel lncRNA genes. Profiles of protein coding genes cluster all CD34+ cells (HSC, LMPP, Thy 1–3, CLP and BCP) separately from CD34neg (Thy4–6). In all analyses, CLP cluster with BCP (circled). LncRNA expression levels completely segregate B (CLP and BCP) and T lineage (Thy 1–6) lineages. Two biological replicates of each cell type are shown.
Figure 5
Figure 5. LncRNA gene expression defines developmental relationships between bone marrow and thymic progenitors prior to complete lineage commitment, independent of protein coding gene expression
Bayesian polytomous model selection of (a) all genes (protein coding and lncRNA genes), and (b) lncRNA genes only, to analyze transcriptional differences between the least committed BM (HSC, LMPP, CLP) and thymic (Thy1, Thy2) progenitors. For a given combination of three cell types (depicted in column headers), each gene was assigned to either the null model (expression similar in all 3 cell types) or one of the alternative (non-null) models (expression different in at least one, and possibly all, cell types, depicted to left of rows 2–5). A, B and C represent the average expression of the gene in each of the three cell types. The null model is defined as A=B=C. The total number of genes classified in non-null models (shown in the black circles along the top row both numerically and by relative size) for a given combination represents an inverse measure of the transcriptional proximity between the cell types in the combination. *For each combination, the proportion of classified genes assigned to each non-null model is indicated by both circle size and depth of color (yellow-green scale). Model selection for combinations containing cell types known to be either from distinct (HSC, BCP, and Thy4), or closely related lineages (Thy4, Thy5, and Thy6) was performed to estimate, within our dataset, the upper and lower bounds for the number of genes in the null model.
Figure 6
Figure 6. Identifying lineage or differentiation stage specific, lncRNA-protein coding gene co-expression modules
Weighted gene co-expression network analysis (WGCNA) across all samples (n=2 biological replicates per cell type) was used to identify modules containing genes with highly correlated expression. a) Shown is WGCNA’s Topological Overlap Matrix (red: high expression correlation, yellow: low expression correlation) for genes in the 5 modules shown in b). (b) Lineage or differentiation stage specific (p<0.05 for expression specificity) modules with the depicted expression profiles were then selected. (c, d) Two suggested screening strategies for the identification of potentially interesting candidate lncRNA genes and lncRNA-protein coding gene co-expression associations within specific modules. Analyses of the hematopoietic stem and progenitor cell (HSPC) module are depicted in the form of circos plots (broken lines in the circumference indicate individual chromosomes) as illustrative examples to demonstrate these strategies. (c) Coding to non-coding association: candidate lncRNA genes were identified based on high co-expression with protein coding genes in the HSPC module that belong to the functional annotation “proto-oncogenes” (includes genes known to be important for HSPC maintenance) (black circles). The three most positively (yellow circles, correlation coefficient >0) and negatively (orange circles, correlation coefficient <0) correlated lncRNA genes for each coding gene are shown. (d) Non-coding to coding association: Among genes with high module membership (module membership adjusted p value<0.01), the 10 most highly expressed lncRNA genes (black circles), and the 3 most positively (yellow circles) and negatively (orange circles) correlated protein coding genes for each of these lncRNA genes are shown.

References

    1. Fatica A, Bozzoni I. Long non-coding RNAs: new players in cell differentiation and development. Nat Rev Genet. 2014;15:7–21. - PubMed
    1. Galy A, Travis M, Cen D, Chen B, Human TB. natural killer, and dendritic cells arise from a common bone marrow progenitor cell subset. Immunity. 1995;3:459–473. - PubMed
    1. Plum J, et al. Human intrathymic development: a selective approach. Semin Immunopathol. 2008;30:411–423. - PubMed
    1. Doulatov S, et al. Revised map of the human progenitor hierarchy shows the origin of macrophages and dendritic cells in early lymphoid development. Nat Immunol. 2010;11:585–593. - PubMed
    1. Six EM, et al. A human postnatal lymphoid progenitor capable of circulating and seeding the thymus. J Exp Med. 2007;204:3085–3093. - PMC - PubMed

Publication types

Substances

Associated data