. 2016 Mar;24(3):570-81.
doi: 10.1038/mt.2015.197. Epub 2015 Oct 27.

Evaluation of TCR Gene Editing Achieved by TALENs, CRISPR/Cas9, and megaTAL Nucleases

Affiliations

Evaluation of TCR Gene Editing Achieved by TALENs, CRISPR/Cas9, and megaTAL Nucleases

Mark J Osborn et al. Mol Ther. 2016 Mar.

Abstract

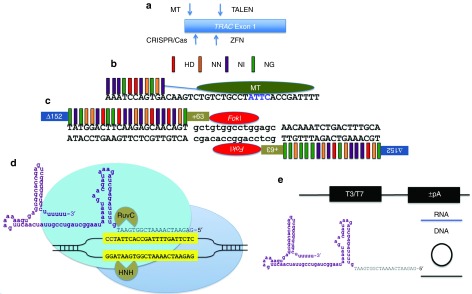
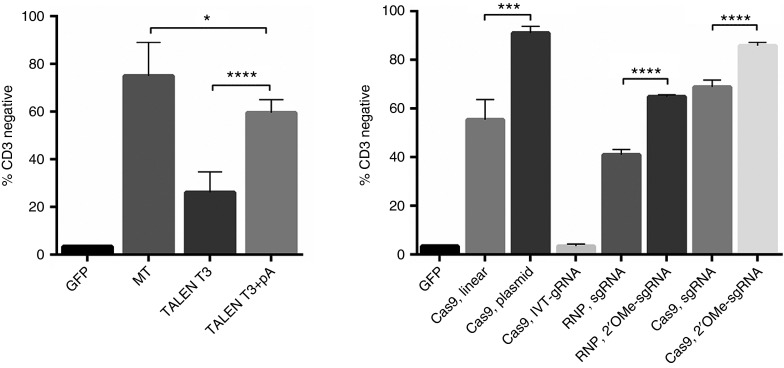
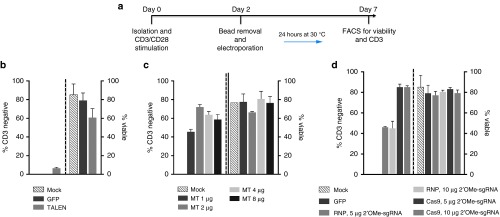
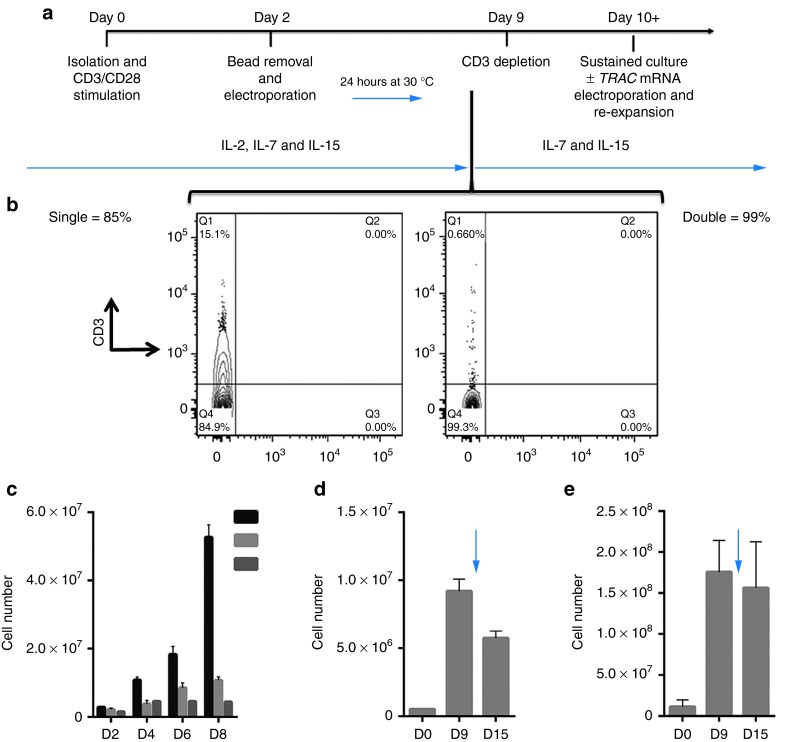
Present adoptive immunotherapy strategies are based on the re-targeting of autologous T-cells to recognize tumor antigens. As T-cell properties may vary significantly between patients, this approach can result in significant variability in cell potency that may affect therapeutic outcome. More consistent results could be achieved by generating allogeneic cells from healthy donors. An impediment to such an approach is the endogenous T-cell receptors present on T-cells, which have the potential to direct dangerous off-tumor antihost reactivity. To address these limitations, we assessed the ability of three different TCR-α-targeted nucleases to disrupt T-cell receptor expression in primary human T-cells. We optimized the conditions for the delivery of each reagent and assessed off-target cleavage. The megaTAL and CRISPR/Cas9 reagents exhibited the highest disruption efficiency combined with low levels of toxicity and off-target cleavage, and we used them for a translatable manufacturing process to produce safe cellular substrates for next-generation immunotherapies.


Figures

Figure 1
Figure 1
TRAC gene targeting and nuclease architecture. (a) Exon 1 of the TRAC locus with the positions of the nuclease target sites shown in relation to one another. (b) TALE recognition code and MT architecture. TALE repeat variable diresidue:DNA base recognition code is represented by colored bars. The amino acid sequences HD recognize DNA base C, NN binds G, NI interacts with A, and NG binds T. Eleven TALE repeat regions are fused to the meganuclease domain by a peptide linker (blue line), and the hybrid protein is termed a megaTAL. The central four bases common to the parental I-OnuI homing endonuclease from which the MT is derived are shown in blue lettering. (c) The dimeric TALEN proteins contain a deletion of 152 amino acids at the N-terminus and maintenance of 63 TAL amino acids at the C-terminus. The individual repeat variable diresidues each bind a single base of DNA and each half array is joined to a subunit of the FokI heterodimeric nuclease. (d) CRISPR/Cas9 architecture. A chimeric gRNA is shown and in purple is the constant portion of the molecule that interacts extensively with the Cas9 protein and the gene-specific component is shown in black letters. The gRNA contacts a target sequence (yellow boxed, black letters) in the context of a–NGG protospacer adjacent motif. The Cas9 protein contains two domains (HNH and RuvC) each responsible for the cleavage of a single strand of DNA. (e) Expression platforms. MT, Cas9, and TALEN mRNA was generated with either a T3 or T7 RNA polymerase promoter and the ‘+/-” refers to the presence or absence of a polyadenylation signal added in vitro. gRNA was produced as an RNA transcript (blue line), a circular plasmid with a human U6 polIII promoter, or a linear fragment generated by PCR containing the U6 promoter and full-length guide RNA sequences (black circle/line).
Figure 2
Figure 2
Nuclease comparison in Jurkat T-ALL cell line. Nucleic acids were delivered by electroporation into Jurkats and 7 days later, the amount of CD3 loss from the cell surface was determined by flow cytometry. (a) The first lane is the GFP transfection control with 95+% CD3 expression levels. Lane two shows the MT disruption rates. Lanes three and four are TALEN optimization conditions. TALEN mRNA was generated from a T3 polymerase promoter without (T3 alone) or with (T3 + pA) a exogenous polyadenylation signal. (b) Cas9 mRNA and protein with varying platforms of gRNA-editing rates. The first lane is GFP followed by a linear DNA fragment encoding the gRNA (Cas9, linear) or circularized gRNA plasmid (Cas9, plasmid) borne expression systems. Following that are a gRNA transcript (Cas9, RNA) produced locally by in vitro transcription and commercially synthesized gRNAs that are unmodified or modified with 2′O-Methyl (2′-OMe) bases that were delivered at doses of 5 or 10 μg by either complexing with Cas9 protein (RNP) or with Cas9 mRNA. Statistical comparisons were done using the Student's t-test. *,***, and **** represent P values (Student's t-test) of <0.05, <0.001, and <0.0001, respectively. Data are from four independent experiments.
Figure 3
Figure 3
Nuclease activity in primary T lymphocytes. (a) Experimental schema. T-cells were isolated from peripheral blood, cultured at a 3:1 CD3/CD28 bead:cell ratio followed by bead removal and electroporation with the indicated dose of nuclease. Cells were cultured transiently for 24 hours at 30 °C. At day 7, gene knockout efficiencies and cellular viability were assessed. (b) CD3 disruption rates using TALEN mRNA. (c) MT mRNA doses of 1, 2, 4, or 8 μg. (d) Cas9 RNP or mRNA with nuclease protected gRNA at 5 or 10 μg. Experiments were done using at least three unrelated donors in quadruplicate. Average CD3 disruption rate with SEM are shown. RNP, ribonucleoprotein. 2′OMe, 2′ O-methly RNA. Dashed lines indicate the demarcation of CD3 disruption rates on the left portion of the graph and the cellular viability on the right side.
Figure 4
Figure 4
Expansion and scaling of CD3-negative cells. (a) Experimental schema. T-cells were harvested, activated, electroporated at 48 hours, and transiently cold shocked. During the first 9 days, the cells were grown in the presence of IL-2, IL-7, and IL-15. Following CD3 cell depletion, the cells were maintained in IL-7 and IL-15 until day 15 when they were enumerated and, if indicated, electroporated with TRAC mRNA and restimulated with CD3/CD28 beads in the presence of IL-2. (b) CD3-negative selection. Post-nuclease treated cells were depleted of CD3-positive cells by completion of one (left) or two (right) treatments with the EasySep procedure. (c) Reintroduction of TRAC mRNA. At day 0, 200,000 cells were treated with MT, and at day 15 post sorted, CD3-negative cells were cultured in IL-7 and IL-15 alone (labeled no TRAC no stim) or with a 3:1 CD3/CD28 bead: cell ratio (labeled no TRAC + stim). A third group received 1 μg of TRAC mRNA via electroporation followed by CD3/CD28 bead stimulation (labeled + TRAC + stim). Cell counts were performed at 2, 4, 6, and 8 days post gene transfer. (d) 500,000 cells were treated with 1 μg of Cas9 mRNA and 5 μg of modified gRNA or (e) 2 × 106 cells were treated with 10 μg of MT. Cells were grown in bulk to day 9 when they were enumerated. Negative depletion was performed, the CD3-null cells were replated in media with IL-7 and IL-15, and cultured to day 15 when they were counted. Experiments are from three donors and are the total from three experiments with four experimental replicates with averages and SEM shown. Arrow indicates CD3 depletion step with subsequent plating of CD3-null cells.
Figure 5
Figure 5
T-cell phenotyping. Cells treated in a manner as those from Figure 4c were harvested at day 15 for flow cytometric analysis for (a) subset composition, (b) cytokines, and (c) surface exhaustion markers. The numbers of CD4 and CD8 cells positive for the indicated marker are shown in each column. In parentheses are the SEM from the individual experiments (n = 3 donors).
Figure 6
Figure 6
CAR transduction and antitumor properties of gene-modified cells. (a) Experimental schema. T-cells were isolated, activated, and cultured in the presence of IL-2, IL-7, and IL-15. CD19 CAR lentiviral transduction was performed on day 0 with a self inactivating (SIN) lentiviral construct encoding the CD19R single-chain variable fragment with the CD28 transmembrane domain (CD28 tm), the 4-1BB costimulatory domain (41BB), the CD3-zeta costimulatory signaling domain (ζ), a self-cleaving T2A picornaviral peptide sequence (T2A), and a non–ligand-binding truncated epidermal growth factor receptor (tEGFR). CD3-negative depletion was performed on day 9 with culture overnight followed by incubation of T-cells with K562 or CD19 transgenic K562 cells. (b) Antitumor activity of engineered T-cells. Equal numbers of T-cells and K562 transgenic cells expressing human CD19 (CD19 Tg K562) or CD19-null K562 were incubated and analyzed for degranulation. Shown is a representative FACS analysis on cells from two donors for CD107a with gating on CD4 and CD8 subsets.
Figure 7
Figure 7
Off-target genome mapping. (a) Experimental schema for IDLV gene trapping. Nuclease mRNA for MT and TALEN and Cas9 mRNA and gRNA plasmid were introduced into Jurkats followed by transduction with an IDLV expressing GFP and puromycin. The IDLV is integrated into loci where a DNA break has occurred. LAM and nRLAM PCR experimental schema. LTR priming results in linear fragments that are converted to double-stranded DNA products that are barcoded, deep sequenced, and interrogated against the genome for off-target sites. (b) TRAC IDLV gene trapping confirmation at on-target TRAC locus. A PCR using LTR- and TRAC-specific primers (red and blue arrows shown in a) revealed presence of the IDLV cargo at the TRAC locus for all of the nuclease reagents visualized by agarose gel.
Figure 8
Figure 8
Off-target assessment in primary T-cells. Target loci were amplified from 100% CD3-null cells and analyzed by the Surveyor assay for evidence of nuclease activity. (a) KAT2B Surveyor cleavage products and sequence alignment to TRAC. Cleavage products are indicated by arrows and quantitative gel analysis indicating is shown at bottom of gel. (b) GBP5 Surveyor image and genomic sequence in relation to TRAC. (c) PDE11A, DR1, HIAT1, KIAA1217, and EXOC2 Surveyor analysis that did not reveal MT OT cleavage. DR1, downregulator of transcription 1; EXOC2, exocyst complex component 2, TBP-binding (negative cofactor); GBP5, guanylate-binding protein 5; HIAT1, hippocampus abundant transcript 1; KAT2B, K(Lysine) acetyltransferase 2B; KIAA1217, sickle tail; PDE11A, phosphodiesterase 11A. Black arrows indicate cleavage products following Surveyor/CELII enzyme digest. The sequence alignments are in relation to the TAL repeat variable diresidues, the intervening spacer sequence separating the TAL from the meganuclease domain, and the meganuclease domain with the I-OnuI homing endonuclease “central four” ATTC sequence. Mismatches between the TRAC and OT sites are lighter shaded letters.

References

    1. Porter, DL, Levine, BL, Kalos, M, Bagg, A and June, CH (2011). Chimeric antigen receptor-modified T cells in chronic lymphoid leukemia. N Engl J Med 365: 725–733. - PMC - PubMed
    1. Dudley, ME, Wunderlich, JR, Shelton, TE, Even, J and Rosenberg, SA (2003). Generation of tumor-infiltrating lymphocyte cultures for use in adoptive transfer therapy for melanoma patients. J Immunother 26: 332–342. - PMC - PubMed
    1. Torikai, H, Reik, A, Liu, PQ, Zhou, Y, Zhang, L, Maiti, S et al. (2012). A foundation for universal T-cell based immunotherapy: T cells engineered to express a CD19-specific chimeric-antigen-receptor and eliminate expression of endogenous TCR. Blood 119: 5697–5705. - PMC - PubMed
    1. Provasi, E, Genovese, P, Lombardo, A, Magnani, Z, Liu, PQ, Reik, A et al. (2012). Editing T cell specificity towards leukemia by zinc finger nucleases and lentiviral gene transfer. Nat Med 18: 807–815. - PMC - PubMed
    1. Berdien, B, Mock, U, Atanackovic, D and Fehse, B (2014). TALEN-mediated editing of endogenous T-cell receptors facilitates efficient reprogramming of T lymphocytes by lentiviral gene transfer. Gene Ther 21: 539–548. - PubMed

Publication types

MeSH terms

Substances