. 2015 Oct 29;526(7575):705-9.
doi: 10.1038/nature15398. Epub 2015 Oct 21.

Thalamic control of sensory selection in divided attention

Affiliations

Thalamic control of sensory selection in divided attention

Ralf D Wimmer et al. Nature. .

Abstract

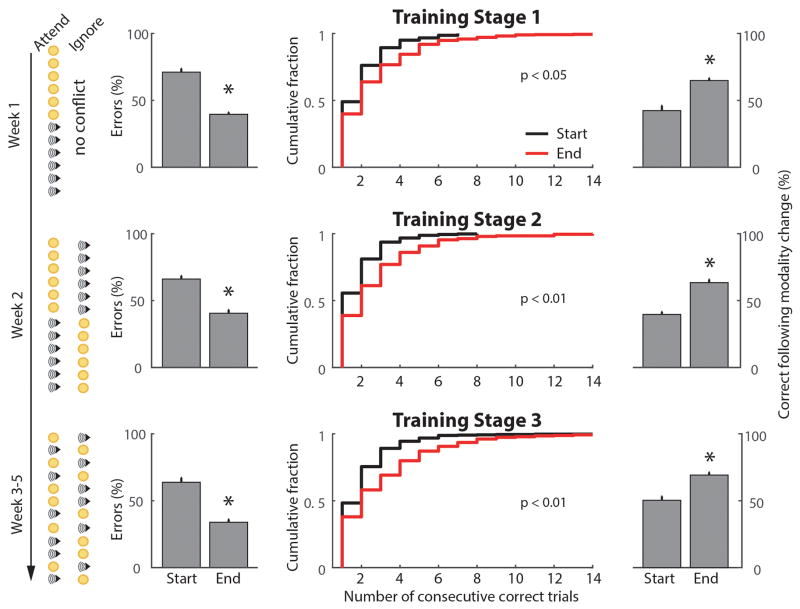
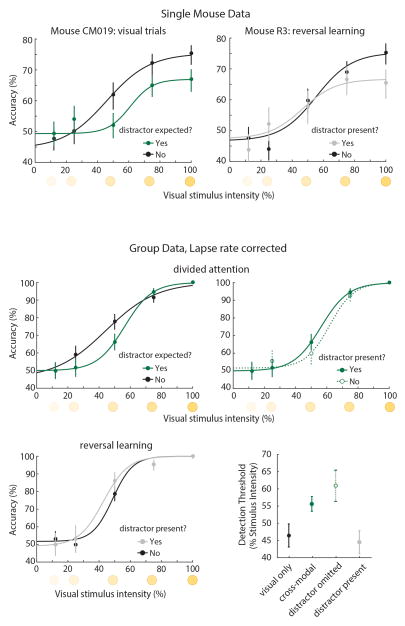
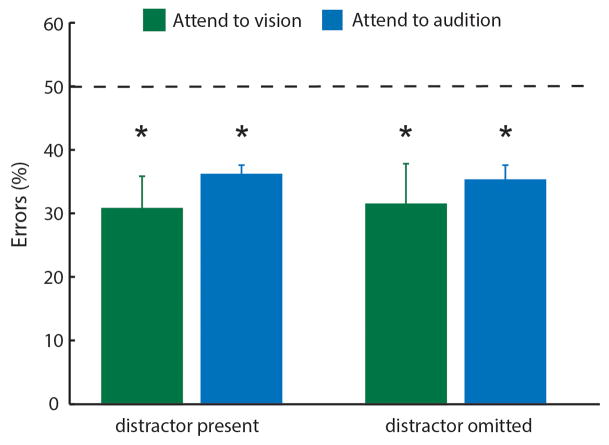
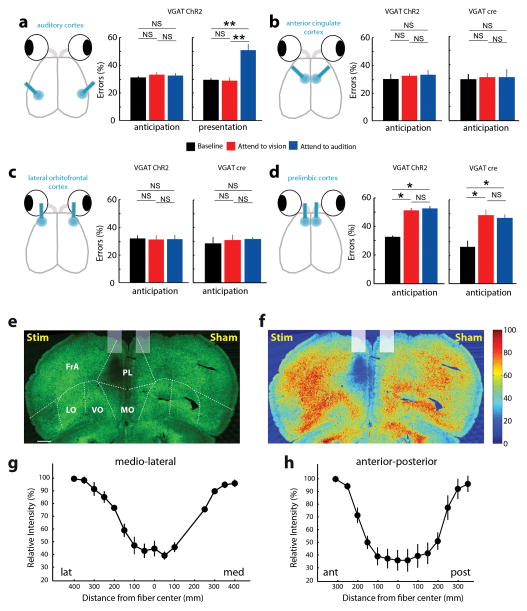
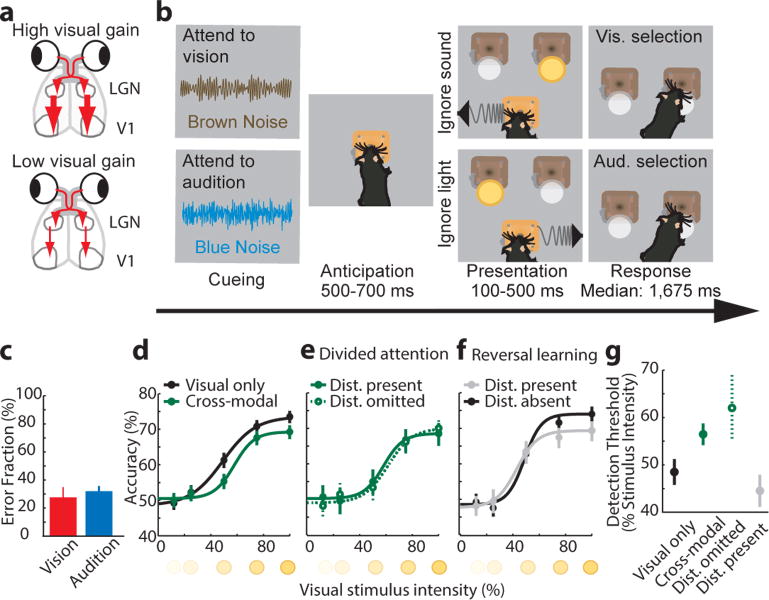
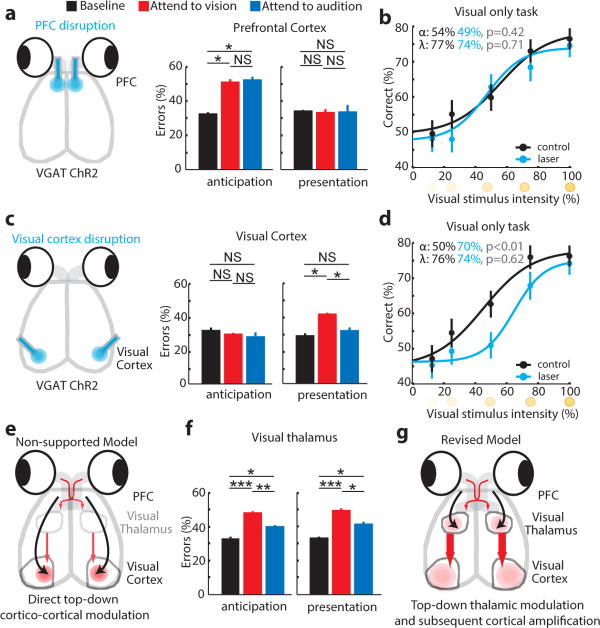
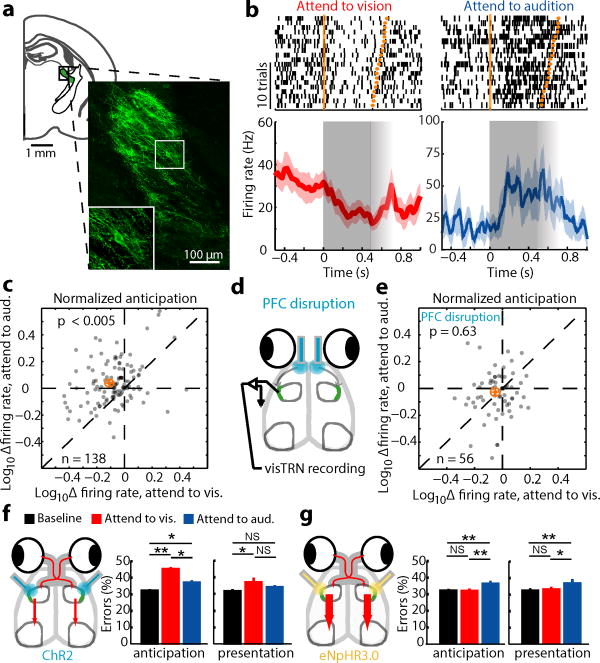
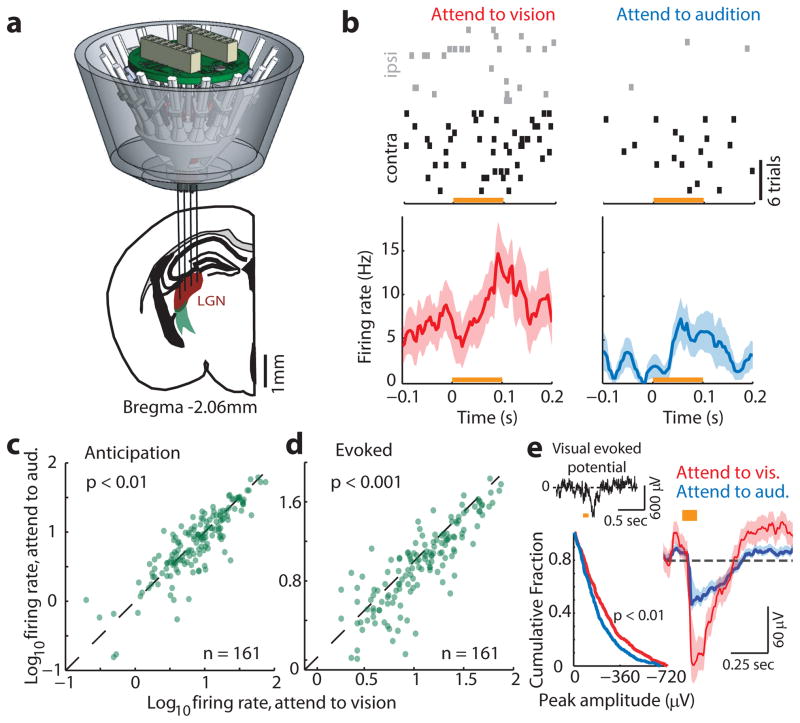
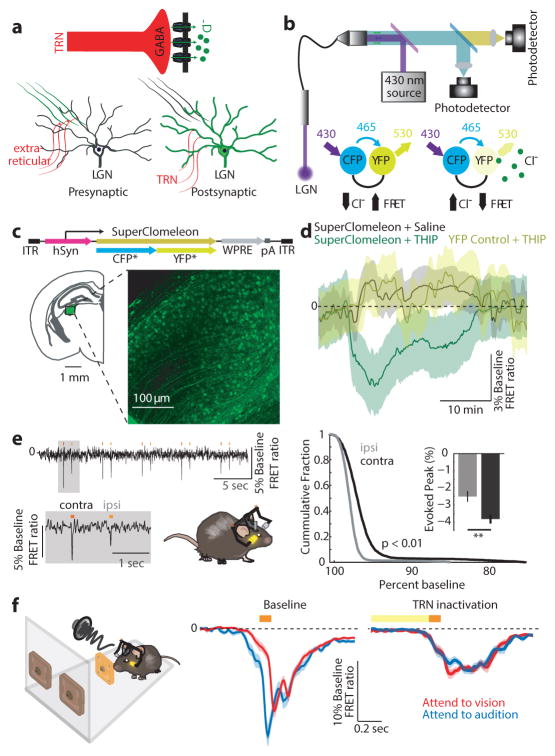
How the brain selects appropriate sensory inputs and suppresses distractors is unknown. Given the well-established role of the prefrontal cortex (PFC) in executive function, its interactions with sensory cortical areas during attention have been hypothesized to control sensory selection. To test this idea and, more generally, dissect the circuits underlying sensory selection, we developed a cross-modal divided-attention task in mice that allowed genetic access to this cognitive process. By optogenetically perturbing PFC function in a temporally precise window, the ability of mice to select appropriately between conflicting visual and auditory stimuli was diminished. Equivalent sensory thalamocortical manipulations showed that behaviour was causally dependent on PFC interactions with the sensory thalamus, not sensory cortex. Consistent with this notion, we found neurons of the visual thalamic reticular nucleus (visTRN) to exhibit PFC-dependent changes in firing rate predictive of the modality selected. visTRN activity was causal to performance as confirmed by bidirectional optogenetic manipulations of this subnetwork. Using a combination of electrophysiology and intracellular chloride photometry, we demonstrated that visTRN dynamically controls visual thalamic gain through feedforward inhibition. Our experiments introduce a new subcortical model of sensory selection, in which the PFC biases thalamic reticular subnetworks to control thalamic sensory gain, selecting appropriate inputs for further processing.


Conflict of interest statement

Competing financial interests

The authors declare no competing financial interests.

Figures

Extended Data Figure 1
Extended Data Figure 1. Cross-Modal Task Training and Performance Validation
Quantification of performance across training stages for the cross-modal task. The trial sequence for each training stage is indicated on the left. Improved performance was observed in the last three days of training relative to the first three for each stage. Column 1 shows the reduction in the error fraction (n = 15 mice,* p < 0.05, Wilcoxon Rank-Sum Test), column 2 shows the number of consecutive correct responses (p values shown, KS-Test), column 3 shows the probability of correct response following a modality shift (* p<0.05, Wilcoxon Rank-Sum Test).
Extended Data Figure 2
Extended Data Figure 2. Effects of cross-modal divided attention in the mouse
Top: Single mouse examples of visual detection performance during cross-modal divided attention and reversal learning. Left: Comparison of performance under visual-only (black) and cross-modal (green) conditions. Although neither contained sensory conflict, the mere expectation of one increased detection threshold (≥124 trials per condition). Right: Detection threshold was not impacted by the presence of an auditory distractor during reversal learning (≥90 trials per condition). Bottom: Group data normalized to peak performance (lapse rate), showing that the effects of divided attention on detection threshold were persistent. Bootstrap estimation of visual detection threshold show a similar pattern as data in Figure 1 (error bars are 95% CI).
Extended Data Figure 3
Extended Data Figure 3. Comparable performance on trial types and intact overall auditory performance despite auditory stimuli elimination on a subset of ‘attend to visual’ trials
Left: Performance was comparable on auditory and maximum intensity visual trials (n = 4 mice, same as in Fig. 1d). Right: Mice exhibited comparable overall performance when auditory stimuli were eliminated from a subset of attend to visual trials.
Extended Data Figure 4
Extended Data Figure 4. Region and timing specific effects of optogenetic manipulation on cross-modal task performance
(a) Optogenetic disruption of auditory cortex during target stimulus anticipation disrupted performance specifically for auditory trials (n = 4 mice, ** p <0.01 Wilcoxson Rank-Sum Test). Disruption of anterior cingulate cortex (b) or lateral orbitofrontal cortex (c) in VGAT-ChR2 mice or following localized injection of ChR2 expressing virus did not affect performance (n = 4 mice, 2 VGAT-ChR2, 2 VGAT-cre, 4 sessions per manipulation) (d) In contrast, PL inactivation led to robust reduction in performance in both types of manipulations (n = 8 mice, 4 VGAT-ChR2 and 4 VGAT-cre, * p <0.05 Wilcoxson Rank-Sum Test). (e–h) Photobleaching experiment quantifying the spread of laser light. Example coronal section (e) showing GFP bleaching following two hour exposure to laser stimulation (6mW, 50Hz, 90% duty cycle). (f–h) Fluorescence intensity quantification shows that extent of light spread is limited to 300μm around the tip of the optic fiber (n = 3 mice).
Extended Data Figure 5
Extended Data Figure 5. Independently adjustable, multi-electrode recording of visTRN neurons
(a, b) Injection of retro-lenti-DIO-ChR2-EYFP into LGN labels visTRN neurons but not LGN interneurons. (a) Histological image is maximal projection of four 2μm confocal planes showing labelling of visTRN neurons (Inset: zoom in showing cell bodies). (b) Image as in (a), but from LGN of the same animal (Inset: zoom in showing terminals). (c) Schematic of independently adjustable multi-electrode drive. (d) Example activity recorded from different depths during adjustment. Distinct patterns of physiological activity are observed along the trajectory in the broadband LFP signal (0.1Hz–32KHz). (e) Highpass filtered signals (600Hz–10kHz) showing spiking activity with isolated, clustered units showing distinguishable waveform characteristics in distinct structures. (f) Example PETH of ChR2 mediated visTRN response to laser activation (top, 473 nM ~4mW stimulation, 20 ms) and to visual stimuli (bottom, 10 ms pulse).
Extended Data Figure 6
Extended Data Figure 6. Distinct visTRN firing rate changes in natural errors compared to PFC disruption
Scatter plots showing the change in absolute firing rate for visTRN neurons for correct (a) incorrect (b) or PFC disrupted trials (c). Insets show the cumulative probability plot of separation from the unity line (no change). While correct trials had a lower firing rate in ‘attend to vision’ than ‘attend to audition’ (n = 138, p < 0.001 Wilcoxon Sign-Rank Test) this pattern was reversed for incorrect trials (n = 138, p < 0.05, Wilcoxon Sign-Rank Test) suggesting that perhaps the animal was attending to the wrong modality. This reversal was not observed in trials with PFC disruption (despite mouse performance being at chance level).
Extended Data Figure 7
Extended Data Figure 7. The impact of PFC disruption on visTRN activity is distinct from naturally-occurring errors
(a) Scatter plots of visTRN neurons comparing their firing rate modulation (change from baseline) under the two distinct anticipatory conditions. Each sample is a single cell. Colors denote significance reached for each cell on a trial-by-trial basis (red, visual; blue, auditory; purple; both; rank-sum test comparison to baseline). Note that in correct performance (n = 138, 4 mice, p < 0.005, Wilcoxon Sign-Rank Test), ‘attend to vision’ resulted in a negative shift and ‘attend to audition’ resulted in a positive shift, consistent with examples shown in Fig. 3. During natural error trials, the modulation is partially reversed for both trial types, suggesting that at least a subset of errors are the result of attending to the wrong modality. On the other hand PFC disruption (n = 56 cells, 2 mice), results in weaker non-uniform effect (‘attend to visual trials’ are less impacted). (b) Quantification of effects seen in a.
Extended Data Figure 8
Extended Data Figure 8. The magnitude of behavioral disruption co-varies with optogenetic manipulation strength of LGN/visTRN
Activation of inhibitory terminals in LGN (Fig. 2), with 90% duty cycle resulted in maximal disruption of cross-modal performance. Activating visually labelled TRN with identical stimulation parameters resulted in a quantitatively lower behavioral impact. Reducing the duty cycle of visTRN stimulation to 10% resulted in no impact on accuracy, as previously shown.
Extended Data Figure 9
Extended Data Figure 9. LGN attentional modulation is not observed on error trials
(a–b) No significant difference was observed in the average firing rate of LGN neurons during stimulus anticipation (p = 0.63, Wilcoxon Sign-Rank Test, n = 161 cells, 4 mice) or presentation (p =0.74, Wilcoxon Sign-Rank Test, n = 161) among trial types when behavioral outcomes were incorrect. C) Similar effects were observed for visual evoked potentials (VEPs; visual: 324, auditory: 302, n = 4 mice).
Extended Data Figure 10
Extended Data Figure 10. Light-evoked fast chloride photometry transients measured in LGN are GABAa receptor dependent and sensitive to visTRN and PL inactivation in the cross-modal task
(a) Peak superclomeleon FRET and YFP control responses to light stimuli (50ms, 0.1 Hz) delivered to the eye contralateral to the recorded LGN (n > 90 trials from 3 mice for superclomeleon and from 4 YFP mice, *** p<0.001, Friedman Test). (b) Chloride photometry transients are sensitive to GABAa receptor antagonist flumazenil in a dose-dependent manner. Left Injection of 15 mg/kg (i.p.) resulted in a 90% peak reduction of light evoked chloride photometry responses that recovered over the course of 90–100 min as predicted by flumazenil pharmacokinetics. Insets show example traces of single events recorded during baseline, peak suppression and recovery. Right Quantification of the maximal suppressive effects and recovery of 5 and 15 mg/kg flumazenil on chloride photometry responses (n > 90 trials from 3 mice, * p < 0.05, ** p < 0.01, Friedman Test). (c) Cumulative distributions of unitary visual evoked superchlomeleon FRET peaks in response to light stimuli in the cross-modal task. Under baseline conditions, ‘attend to audition’ trials exhibited significantly larger amplitudes than ‘attend to vision’ trials, consistent with average data in Fig 5f. Optogenetic silencing of visTRN eliminated the difference between trial types and resulted in peak amplitudes comparable to baseline ‘attend to vision’ trials (n = 3 mice, p < 0.005 for ‘attend to audition’ trials vs. all other trial types, Kolmogorov-Smirnov statistics with Bonferroni correction). (d) Combined optogenetic inactivation of different frontal cortical regions and chloride photometry in LGN while mice perform the cross-modal task. Only PL inactivation eliminates differential inhibition between visual and auditory trials (n = 6 mice, *** p<0.001, Wilcoxon Rank-Sum Test).
Figure 1
Figure 1. Cross-modal divided attention in the mouse
(a) Hypothesized control of visual gain under cross-modal conditions (LGN; lateral geniculate nucleus; V1: primary visual cortex). (b) Task design. A mouse is simultaneously informed about trial availability and the nature of the target stimulus through binaurally delivered noise. In this schematic, brown noise denotes ‘attend to vision’ and blue noise denotes ‘attend to audition’. Following a variable anticipation where the mouse is required to hold its snout in a centrally located poke, conflicting auditory and visual stimuli are presented. By design, the task is asymmetric, having a visual detection component (presence or absence of light at the reward location) and an auditory discrimination component (upsweep; turn left, downsweep; turn right). (c) Mice exhibited comparable performance on visual and auditory trials (mean ± s.e.m., n = 15 mice). (d) Visual detection performance in cross-modal trials compared to visual-only trials (n = 4 mice, ≥421 trials per condition). Note that both detection threshold and peak performance were lower in the cross-modal condition. (e) Eliminating auditory distractor in the cross-modal condition did not impact the visual detection psychometric function (n = 4 mice, ≥211 trials per condition). (f) When mice were not differentially cued but instead ignored the auditory stimulus by learning that it was not rewarded over a full session (reversal learning) visual detection threshold did not change (n = 6 mice, ≥242 trials per condition). (g) Visual detection threshold (bootstrap computed) of the pertinent psychometric functions in c–e. Error bars in (d–g) are 95% confidence intervals, and therefore, non-overlap denotes significance of p < 0.05.
Figure 2
Figure 2. Evidence for top-down thalamic modulation in divided attention
(a) Disrupting PFC activity by delivering blue laser pulses (50Hz, 18msec; 90% duty cycle) impaired task performance at 100% stimulus intensity on both modalities equally only when manipulation was performed during stimulus anticipation (n = 4 VGAT-ChR2 mice, * p < 0.05, Wilcoxon rank-sum test). (b) Effect was related to the cross-modal nature of the task, not its difficulty, as PFC inhibition did not impact performance on a visual-only task. (c) Disruption of primary visual cortex during stimulus presentation impaired performance on visual trials (n = 4 mice). (d) Effect in c was related to task difficulty, as it increased visual detection threshold in a visual-only task. (e) The data in a and c do not support a causal role for PFC interactions with primary visual cortex in performance. (f) Perturbing visual thalamic function in a manner similar to cortical perturbations in VGAT-ChR2 mice preferentially diminished performance on visual trials both during anticipation and presentation of target stimuli (n = 12 sessions from 3 mice, * p < 0.05, ** p < 0.01, *** p < 0.001, Wilcoxon rank-sum test). (g) Finding in f supports a model in which PFC activity influences thalamic sensory processing. Bar graphs represent mean ± s.e.m. Error bars for psychometric curves are 95% confidence intervals.
Figure 3
Figure 3. PFC-dependent visTRN modulation suggests PFC-TRN functional coupling is required for visual gain control
(a) Intersectional tagging of visTRN based on connectivity and genetic identity. Inset: Maximum projection of ten 1μm confocal images. Cells were labeled with ChR2-EYFP and stained with anti-GFP. (b) Raster of two visTRN neurons triggered on task initiation. Note the reduction of firing rate between the first trigger (trial initiation) and second one (stimulus presentation) during the ‘attend to vision’ condition, but the opposite during ‘attend to audition’ condition. Fading gray boxes denote the jitter of the anticipatory period. (c) Group analysis of b, showing a scatter plot of 138 visTRN neurons (n = 4 animals, p < 0.005, Wilcoxon rank-sum test performed over all cells). Orange crosshair indicates mean ± 95% confidence interval. (d) PFC activity was disrupted during stimulus anticipation to examine impact on visTRN activity. (e) PFC disruption diminished visTRN attentional modulation. (f–g) Behavioral performance is causally dependent on visTRN attentional modulation. (f) Optogenetic activation of retrogradely tagged visTRN neurons resulted in preferential diminishing of visual trials (mean ± s.e.m., n = 12 sessions from 3 mice, * p < 0.05, ** p < 0.01, *** p < 0.001, Wilcoxon rank-sum Test), consistent with this manipulation lowering visual gain. (g) In contrast, optogenetic inhibition of visTRN preferentially diminished auditory trials, consistent with inappropriate visual gain increase (n = 12 sessions from 3 mice).
Figure 4
Figure 4. Direct evidence for visual thalamic gain modulation in divided attention
(a) Cartoon depiction of multi-electrode targeting of LGN in freely behaving mice. (b) Example of differential modulation of a single LGN cell spiking under the two anticipatory task conditions. Note that contralateral eye stimulation (with respect to recording electrodes) resulted in more robust visual drive. More importantly, the cell discharged more spikes during anticipation and presentation when attention was directed towards vision. (c–d) Group analysis of phenomenon in b (n = 161 cells, 4 mice, Wilcoxon rank-sum test). (e) Enhanced visual responses were similarly observed at the level of visual evoked potentials (top left, example VEP; bottom left, cumulative distribution of VEP amplitudes, showing higher values for ‘attend to vision’ trials (p < 0.01, KS test). Right, average VEP from 4 mice (684 visual and 633 auditory trials from 29 sessions), shaded errors are 95% confidence intervals.
Figure 5
Figure 5. Measuring bulk intracellular [Cl] in vivo shows dynamic changes in LGN inhibition during behavior
(a) Possible mechanisms for LGN firing rate modulation; extra-reticular inputs can change activity by presynaptic inhibition of feedforward excitation while visTRN inhibits LGN directly. (b) FRET photometry setup and schematic of CFP-to-YFP FRET. (c) Cloning of the FRET-based Cl indicator superclomeleon into an AAV followed by in vivo expression in the LGN. (d) Pharmacological confirmation of the technical feasibility of superclomeleon FRET for GABAa mediated increase in intracellular [Cl] by injection of the GABAa agonist THIP. Note that the YFP control mice did not show similar signals (n = 3 mice per condition, shaded errors are 95% confidence intervals). (e) Mice showed visual-evoked superclomeleon FRET responses that are stronger for the contralateral eye, as would be predicted (n = 3 mice, p < 0.05, Wilcoxon Rank-sum Test). Yellow bars mark the display of the light stimuli. (f) Left Cartoon depiction of photometry in the cross-modal task, where the visual stimulus was signaled through a head-mounted LED as in Fig. 4 (see Supplementary Video 1 for illustration). Middle Differential visual-evoked [Cl] LGN responses in relation to the modality anticipated (363 visual and 274 auditory correct trials from 6 mice). Shaded errors are 95% confidence intervals. Note that ‘attend to audition’ trials showed an earlier increase in [Cl] (decreased superclomeleon FRET) and the separation between the two traces started prior to stimulus onset, consistent with differential anticipatory changes of visTRN activity. Right Optogenetic TRN inactivation eliminates this differential response (101 visual and 82 auditory correct trials from 3 mice).

Comment in

References

    1. Miller EK, Cohen JD. An integrative theory of prefrontal cortex function. Annu Rev Neurosci. 2001;24:167–202. - PubMed
    1. Buschman TJ, Miller EK. Top-down versus bottom-up control of attention in the prefrontal and posterior parietal cortices. Science. 2007;315:1860–2. - PubMed
    1. Fritz J, Shamma S, Elhilali M, Klein D. Rapid task-related plasticity of spectrotemporal receptive fields in primary auditory cortex. Nat Neurosci. 2003;6:1216–23. - PubMed
    1. Rodgers CC, DeWeese MR. Neural correlates of task switching in prefrontal cortex and primary auditory cortex in a novel stimulus selection task for rodents. Neuron. 2014;82:1157–70. - PubMed
    1. Zhang S, et al. Selective attention. Long-range and local circuits for top-down modulation of visual cortex processing. Science. 2014;345:660–5. - PMC - PubMed

Publication types

LinkOut - more resources