. 2015 Dec 1;128(23):4353-65.
doi: 10.1242/jcs.176057. Epub 2015 Oct 26.

Luman is involved in osteoclastogenesis through the regulation of DC-STAMP expression, stability and localization

Affiliations

Luman is involved in osteoclastogenesis through the regulation of DC-STAMP expression, stability and localization

Soshi Kanemoto et al. J Cell Sci. .

Abstract

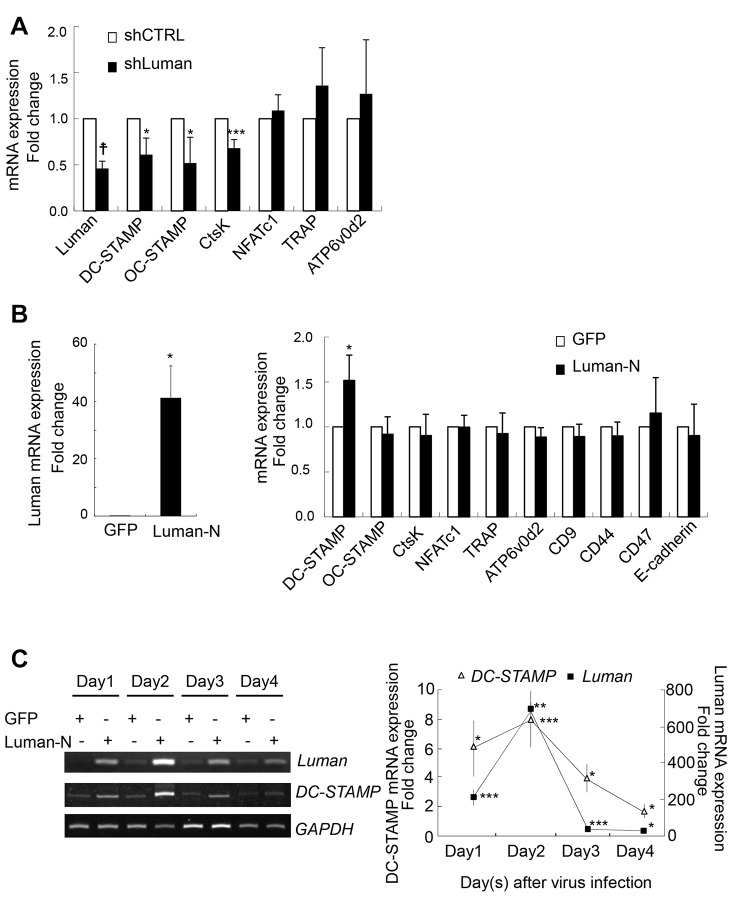
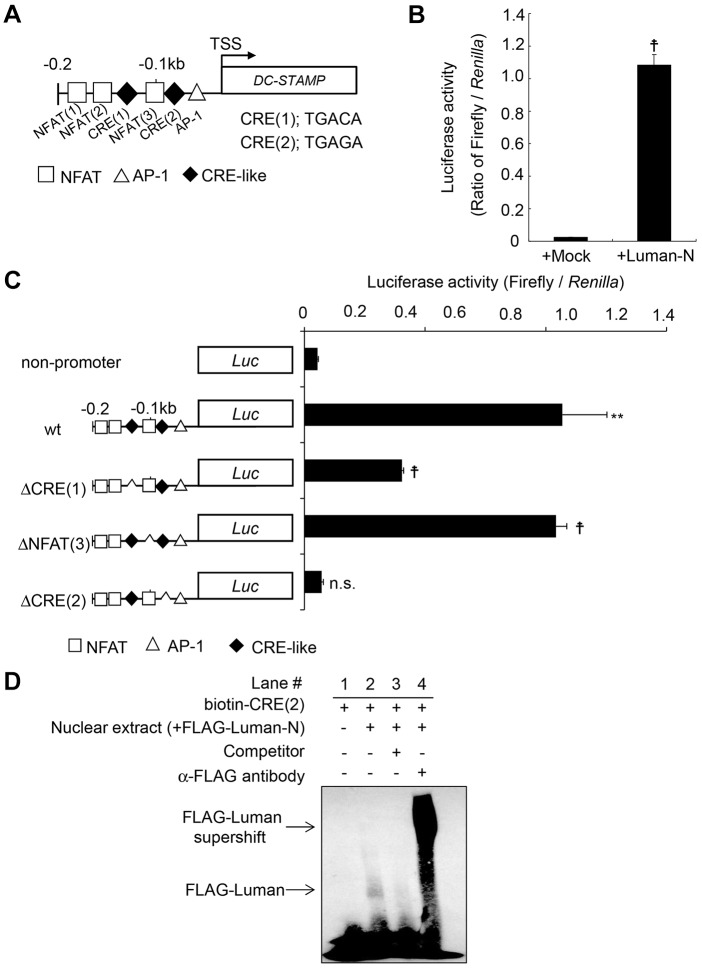
Luman (also known as CREB3) is a type-II transmembrane transcription factor belonging to the OASIS family that localizes to the endoplasmic reticulum (ER) membrane under normal conditions. In response to ER stress, OASIS-family members are subjected to regulated intramembrane proteolysis (RIP), following which the cleaved N-terminal fragments translocate to the nucleus. In this study, we show that treatment of bone marrow macrophages (BMMs) with cytokines - macrophage colony-stimulating factor (M-CSF) and RANKL (also known as TNFSF11) - causes a time-dependent increase in Luman expression, and that Luman undergoes RIP and becomes activated during osteoclast differentiation. Small hairpin (sh)RNA-mediated knockdown of Luman in BMMs prevented the formation of multinucleated osteoclasts, concomitant with the suppression of DC-STAMP, a protein that is essential for cell-cell fusion in osteoclastogenesis. The N-terminus of Luman facilitates promoter activity of DC-STAMP, resulting in upregulation of DC-STAMP expression. Furthermore, Luman interacts with DC-STAMP, and controls its stability and localization. These results suggest that Luman regulates the multinucleation of osteoclasts by promoting cell fusion of mononuclear osteoclasts through DC-STAMP induction and intracellular distribution during osteoclastogenesis.

Keywords: Cell-cell fusion; Endoplasmic reticulum; Osteoclastogenesis; Transcription factor.


Conflict of interest statement

Competing interests

The authors declare no competing or financial interests.

Figures

Fig. 1.
Fig. 1.
Luman is induced during osteoclast differentiation and cleaved in response to RANKL signaling. (A) Schematic representation of the domain structure of murine Luman, BBF2H7, OASIS and ATF6α. The basic leucine zipper (bZIP; basic region and leucine zipper), putative transmembrane domain and luminal domain are indicated. (B) Western blot analysis for Luman protein in cell lines originally derived from bone tissues: ATDC5, chondrocytes; MC3T3-E1, osteoblast-like cells; and RAW264, macrophages. Cells were cultured with or without 1 µM MG132 proteasome inhibitor for 6 h. Cell lysates were separated with SDS-PAGE, and western blotting was performed with an antibody against Luman. (C) RAW264 cells were cultured with 1 µM brefeldin A (BFA), 1 µg/ml tunicamycin (Tm), or 1 µM thapsigargin (Tg) for the indicated time periods. Western blotting was performed with an antibody against Luman (upper panel). Middle panel shows the expression levels of actin used as the internal control. Lower panels show RT-PCR analysis of XBP-1 and GAPDH mRNA in each sample. Note that spliced forms of XBP-1 (XBP-1-s) were detected in cells that had been treated with tunicamycin and thapsigargin, but Luman N-termini were not detected under such conditions. (D) RAW264 cells were cultured with RANKL for the indicated time periods. Cell lysates were subjected to western blotting with an antibody against Luman. Relative quantified data of Luman N-terminus bands are indicated below the Luman blot. The intensity of the Luman N-terminus band in 0 h without MG132 treatment was set as 1.0. Arrowhead indicates Luman N-terminus bands. (E) BMMs were cultured with M-CSF and RANKL for the indicated time periods. Cell lysates were analyzed by western blotting with an antibody against Luman. The mRNA expression of the indicated genes was determined by using RT-PCR analysis. (F) BMMs were cultured with M-CSF and RANKL in the presence of 1 µM MG132 for 6 h. Cell lysates were analyzed by western blotting with an antibody against Luman. Note that the Luman N-terminus was detected in the presence of MG132 (arrowhead). For C–F, cell lysates from Luman-transfected HeLa cells were used as a positive control. Asterisk indicates non-specific bands.
Fig. 2.
Fig. 2.
Subcellular localization of Luman during osteoclastogenesis. BMMs were infected with a retroviral vector expressing FLAG-tagged Luman. After viral infection, BMMs were cultured with M-CSF for 2 days. Thereafter, infected BMMs were incubated with M-CSF and RANKL for the indicated time periods. Cells were treated with proteasome inhibitor MG132 4 h before fixation, and then were fixed with cold methanol. Immunostaining was performed with antibodies against FLAG and calnexin (CNX), an ER marker. Nuclear counter-staining was conducted with DAPI. At day 2, signals for Luman in the nucleus as well as in the ER were detected (arrows). Scale bar: 20 µm.
Fig. 3.
Fig. 3.
Knockdown of Luman prevents osteoclast multinucleation. (A) BMMs were infected with control shRNA retroviral vector (shCTRL) or shRNA retroviral vectors against (shLuman #1, shLuman #2). The expression levels of Luman were determined with real-time PCR analysis. Data are from four independent experiments. Values indicate mean±s.e.m. *P<0.05; **P<0.01. (B) BMMs were infected with control retroviral vector (GFP), shCTRL, shLuman #1 or shLuman #2). Each cell lysate was subjected to western blot analysis with an antibody against Luman. Cell lysate from Luman-transfected HeLa cells was used as a positive control. Asterisks indicate a non-specific band. Relative quantified data of bands representing full-length Luman were indicated below the Luman blot. The intensity of the band representing full-length Luman in the control sample was set as 1.0. (C) BMMs that had been infected with shCTRL or shLuman constructs were cultured with M-CSF and RANKL for the indicated periods. After incubation, cells were fixed and stained with TRAP-staining solution. Scale bars: 100 µm. (D) TRAP-positive multinucleated cells (MNC) with more than three nuclei were counted. Comparison of the number of TRAP-positive multinucleated cells between shCTRL- and shLuman-expressing cells revealed a significant decrease in the number of multinucleated cells in shLuman-infected cells. Data are from three independent experiments. Values indicate mean±s.d. P<0.001; ***P<0.005.
Fig. 4.
Fig. 4.
Luman regulates DC-STAMP expression during osteoclastogenesis. (A) BMMs that had been infected with shCTRL or shLuman #1 (shLuman) retroviral vectors were cultured with M-CSF and RANKL for 2 days. The expression levels of osteoclast genes were determined by using real-time PCR analysis. Data are from three independent experiments. Values indicate mean±s.e.m. *P<0.05; ***P<0.005; P<0.001. (B) BMMs were infected with GFP- or Luman-N-terminus-expressing retroviral vectors (GFP and Luman-N, respectively). After viral infection, BMMs were cultured with only M-CSF for 4 days. The expression levels of Luman and osteoclast genes were determined by real-time PCR analysis. Left, Luman mRNA expression levels in GFP or Luman-N infected cells. Right, mRNA expression levels of each gene in GFP- (□) or Luman-N-infected (▪) cells. Data are from three independent experiments. Values indicate mean±s.e.m. *P<0.05. (C) BMMs that had been infected with GFP- or Luman-N-terminus-expressing retroviral vectors were cultured with only M-CSF for the indicated periods. The expression levels of Luman and DC-STAMP mRNA were determined by using RT-PCR (left) and real-time PCR (right) analyses. Quantification chart indicates the fold induction relative to that of GFP-expressing samples. Data are from three independent experiments. Values indicate mean±s.e.m. *P<0.05; **P<0.01; ***P<0.005.
Fig. 5.
Fig. 5.
Luman mediates the induction of DC-STAMP through CRE-like sequence in the DC-STAMP promoter. (A) Schematic representation of the 0.2-kb promoter region of the murine DC-STAMP gene. AP-1 site (△), NFAT site (□) and CRE-like sequence site (◆) are indicated. TSS, transcription start site. Each CRE-like sequence is indicated. (B) The reporter plasmid of the 0.2-kb murine DC-STAMP promoter fused with the luciferase gene was co-transfected with the pcDNA empty vector (Mock) or Luman N-terminus pcDNA expression vector (Luman-N) into RAW264 cells. Luciferase activity was measured at 24 h after transfection. Data are from three independent experiments. Values indicate mean±s.e.m. P<0.001. (C) Luciferase reporter assay with a series of deletion mutants of the DC-STAMP promoter reporter plasmids. Reporter plasmids in which the NFAT-binding site or each CRE-like sequence had been deleted from the DC-STAMP promoter region were used. Reporter activities were measured in the same way as described in B. Data are from three independent experiments. Values indicate mean±s.e.m. **P<0.01; P<0.001; n.s., not significant. (D) Electrophoretic mobility shift assay. The biotin-labeled probes, including the CRE(2) site of the DC-STAMP promoter, were incubated with nuclear extract derived from FLAG–Luman-N expressing HeLa cells. Note that the binding of FLAG–Luman-N to the CRE(2) site was abolished by a competitor (lane 3), and a supershift after incubation with anti-FLAG antibodies (lane 4) was detected.
Fig. 6.
Fig. 6.
Luman is involved in multinuclear osteoclast formation through the regulation of DC-STAMP expression. (A) BMMs in which Luman had been knocked down were infected with retroviral vectors encoding GFP, various types of Luman or DC-STAMP. Thereafter, infected BMMs were incubated with M-CSF and RANKL for 3 days. After incubation, cells were fixed and stained with TRAP-staining solution. Scale bars: 200 µm. (B) TRAP-positive multinucleated cells (MNCs) with more than three nuclei from samples represented in A, were counted. Data are from three independent experiments. Values indicate mean±s.d. *P<0.05; **P<0.01 [one-way ANOVA with post-hoc Tukey honest significant difference (HSD) test]. (C) Real-time PCR analysis of Luman, DC-STAMP and TRAP mRNA. Luman N-terminal (N-term) primers detect the mRNA generated from Luman full-length and Luman N-terminus vectors. Luman C-terminal (C-term) primers detect the mRNA generated from Luman full-length and Luman-ΔN vectors. Note that the expression levels of TRAP mRNA were not altered even when Luman was introduced into shLuman-expressing BMMs. Data are from three or four independent experiments. Values indicate mean±s.d. **P<0.01 vs control (shCTRL) (one-way ANOVA with post-hoc Tukey HSD test).
Fig. 7.
Fig. 7.
Luman interacts with DC-STAMP and is localized to the Golgi. (A) Co-immunoprecipitation analyses of HeLa cells expressing Luman and DC-STAMP. Cells were co-transfected with expression plasmids for Luman tagged with FLAG at the N-terminus (FLAG–Luman) and DC-STAMP tagged with HA at the C-terminus (DC-STAMP–HA). Cell lysates were immunoprecipitated with antibodies against HA (a-HA), and the immunoprecipitated (IP) samples were subjected to western blotting (WB) with an antibody against FLAG. (B) Subcellular localization of Luman and DC-STAMP that had been expressed in HeLa cells. FLAG–Luman and/or DC-STAMP–HA expression plasmids were transfected into HeLa cells. The transfected cells were immunostained with antibodies against FLAG or HA. Note that co-expression of Luman and DC-STAMP caused the emergence of perinuclear accumulation. Arrows indicate accumulated signals of Luman and DC-STAMP. Scale bars: 10 µm. (C) Double-staining for FLAG and Golgi markers on the cells expressing FLAG–Luman and DC-STAMP–HA. HeLa cells were co-transfected with FLAG–Luman and DC-STAMP–HA expression plasmids. The transfected cells were immunostained with antibodies against FLAG and GM130 (cis-Golgi marker) or against FLAG and TGN46 (trans-Golgi marker). Note that perinuclear accumulation of FLAG–Luman and DC-STAMP–HA overlaps with that of the trans-Golgi marker. Arrows indicate accumulated signals for Luman and DC-STAMP. Scale bars: 10 µm.
Fig. 8.
Fig. 8.
Luman defines the localization and stabilization of DC-STAMP by interacting with it. (A) Schematic representation of the domain structure of murine DC-STAMP and mapping of the binding region for Luman. Co-immunoprecipitation experiments with various truncated DC-STAMP mutants revealed the binding region in DC-STAMP for Luman. Solid squares with Roman numerals indicate the transmembrane domains of DC-STAMP. Putative binding regions are highlighted in red. The degrees of association between Luman and the DC-STAMP constructs shown are indicated as follows: circle, strong; triangle, weak; cross, none. Numbers represent amino acid residues. (B) Co-immunoprecipitation followed by western blot analysis. HeLa cells were co-transfected with expression plasmids for FLAG–Luman and full-length DC-STAMP [DC-STAMP(full)–HA] or HA-tagged truncated DC-STAMP [DC-STAMP(1-167)–HA]. Cell lysates were immunoprecipitated (IP) with antibodies against HA (a-HA), and the immunoprecipitated proteins were subjected to western blotting with antibodies against FLAG or HA. Note that Luman only interacts with the full-length DC-STAMP. (C) Immunostaining for FLAG–Luman and DC-STAMP–HA. HeLa cells were co-transfected with FLAG–Luman and DC-STAMP(full)–HA or DC-STAMP(1-167)–HA expression plasmids, and immunostained with antibodies against FLAG (green) and HA (red). Upon co-expression of FLAG–Luman and DC-STAMP(full)–HA, both proteins accumulated at the perinuclear region. DC-STAMP(1-167)–HA was scarcely detected in the absence of treatment with MG132. Arrows indicate accumulated signals for Luman and DC-STAMP. Scale bars: 10 µm. (D) Subcellular fractionation analyses of Luman and DC-STAMP. HeLa cells were co-transfected with expression plasmids for FLAG–Luman and DC-STAMP(full)–HA or DC-STAMP(1-167)–HA. The microsome membranes from cell lysates were ultracentrifuged and fractionated in an iodixanol gradient. Each fraction was subjected to western blotting. TGN46, GM130 and calnexin (CNX) were examined as specific intracellular markers for the trans-Golgi, cis-Golgi and ER, respectively. TGN46 is mainly distributed in fractions 2 and 3; GM130 in fractions 4–6; CNX in fractions 7–9.

Similar articles

Cited by

References

    1. Asada R., Kanemoto S., Kondo S., Saito A. and Imaizumi K. (2011). The signalling from endoplasmic reticulum-resident bZIP transcription factors involved in diverse cellular physiology. J. Biochem. 149, 507-518. 10.1093/jb/mvr041 - DOI - PubMed
    1. Eleveld-Trancikova D., Triantis V., Moulin V., Looman M. W. G., Wijers M., Fransen J. A. M., Lemckert A. A. C., Havenga M. J. E., Figdor C. G., Janssen R. A. J. et al. (2005). The dendritic cell-derived protein DC-STAMP is highly conserved and localizes to the endoplasmic reticulum. J. Leukoc. Biol. 77, 337-343. 10.1189/jlb.0804441 - DOI - PubMed
    1. Eleveld-Trancikova D., Sanecka A., van Hout-Kuijer M. A., Looman M. W. G., Hendriks I. A. M., Jansen B. J. H. and Adema G. J. (2010). DC-STAMP interacts with ER-resident transcription factor LUMAN which becomes activated during DC maturation. Mol. Immunol. 47, 1963-1973. 10.1016/j.molimm.2010.04.019 - DOI - PubMed
    1. Grigoriadis A. E., Wang Z. Q., Cecchini M. G., Hofstetter W., Felix R., Fleisch H. A. and Wagner E. F. (1994). c-Fos: a key regulator of osteoclast-macrophage lineage determination and bone remodeling. Science 266, 443-448. 10.1126/science.7939685 - DOI - PubMed
    1. Hartgers F. C., Vissers J. L. M., Looman M. W. G., van Zoelen C., Huffine C., Figdor C. G. and Adema G. J. (2000). DC-STAMP, a novel multimembrane-spanning molecule preferentially expressed by dendritic cells. Eur. J. Immunol. 30, 3585-3590. 10.1002/1521-4141(200012)30:12<3585::AID-IMMU3585>3.0.CO;2-Y - DOI - PubMed

Publication types

MeSH terms