

Fundamental role for the KCNE4 ancillary subunit in Kv7.4 regulation of arterial tone
- PMID: 26503181
- PMCID: PMC4704525
- DOI: 10.1113/JP271286
Fundamental role for the KCNE4 ancillary subunit in Kv7.4 regulation of arterial tone
Abstract
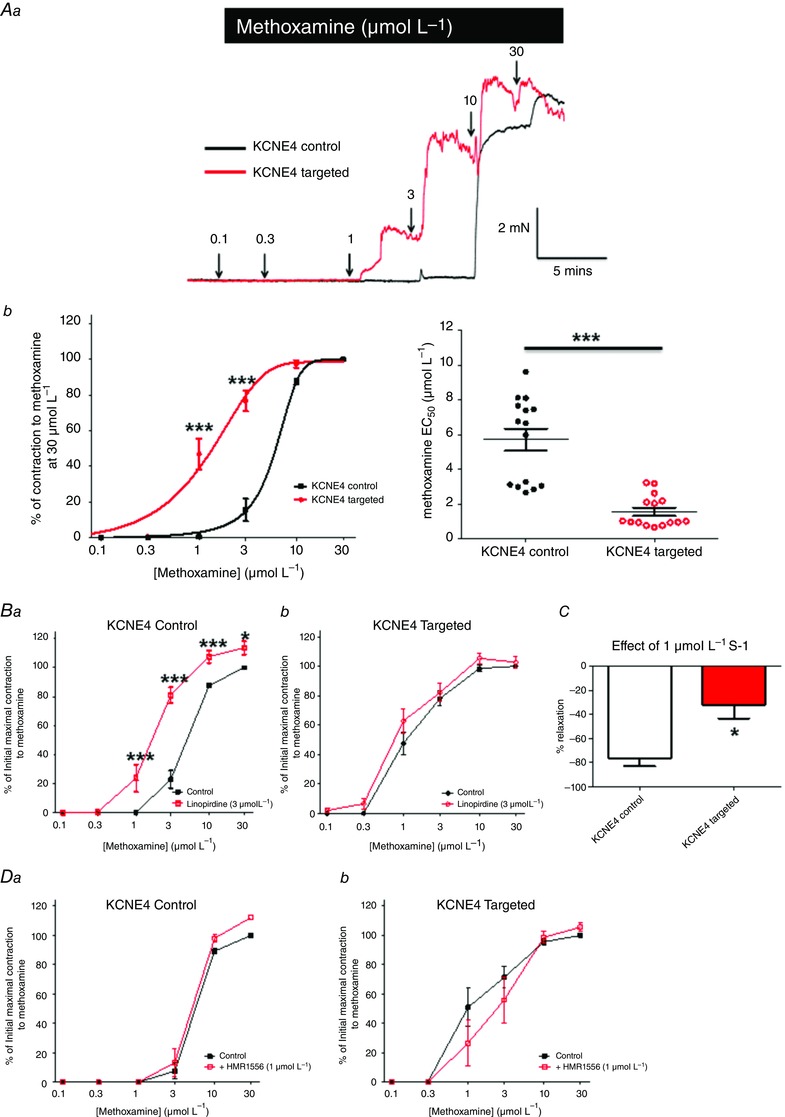
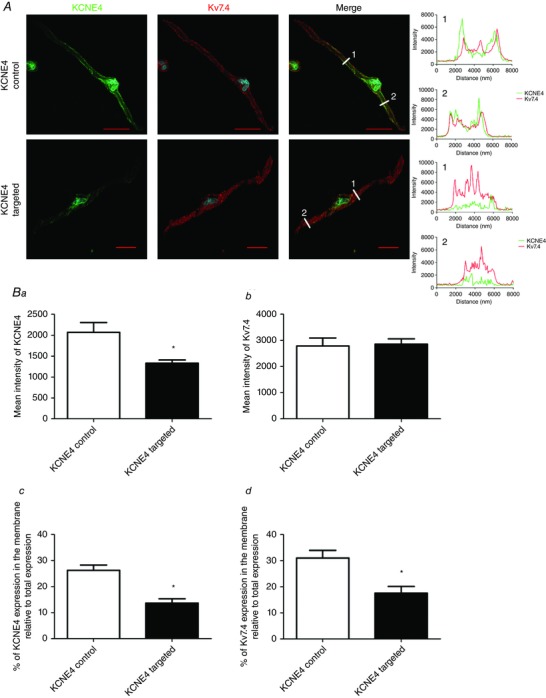
Key points: KCNE4 alters the biophysical properties and cellular localization of voltage-gated potassium channel Kv7.4. KCNE4 is expressed in a variety of arteries and, in mesenteric arteries, co-localizes with Kv7.4, which is important in the control of vascular contractility. Knockdown of KCNE4 leads to reduced Kv7.4 membrane abundance, a depolarized membrane potential and an augmented response to vasoconstrictors. KCNE4 is a key regulator of the function and expression of Kv7.4 in vascular smooth muscle.
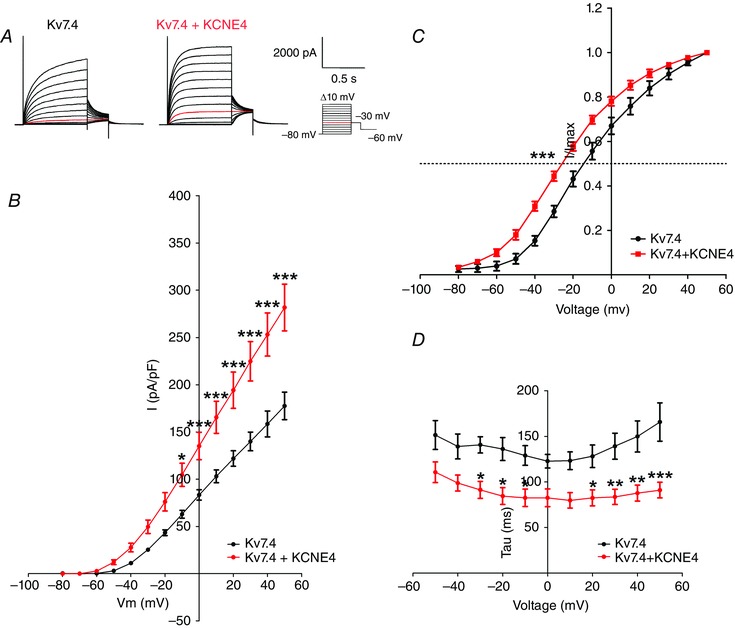
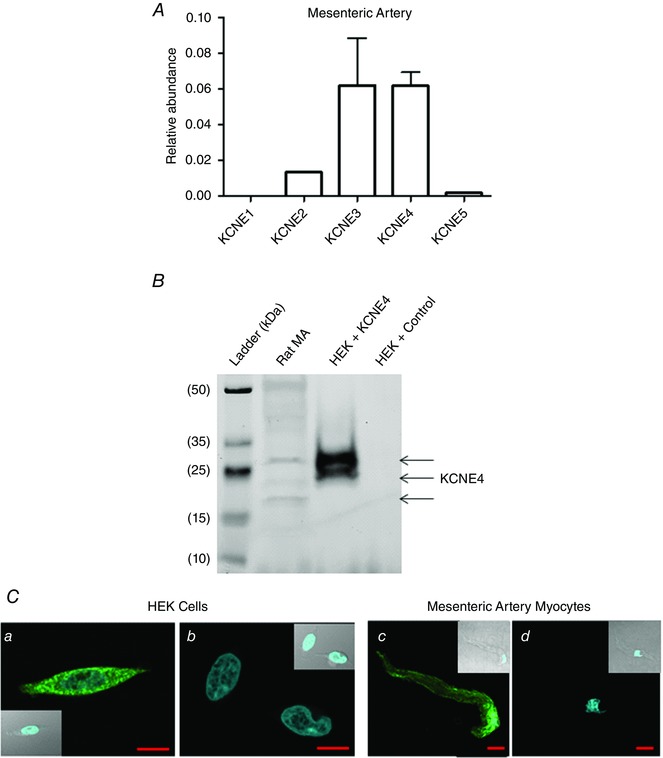
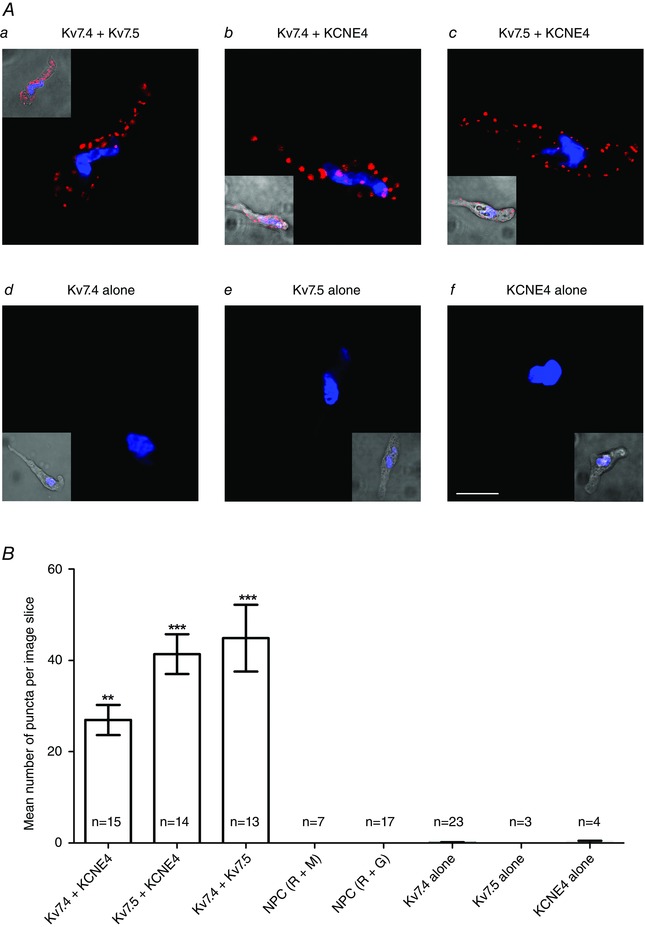
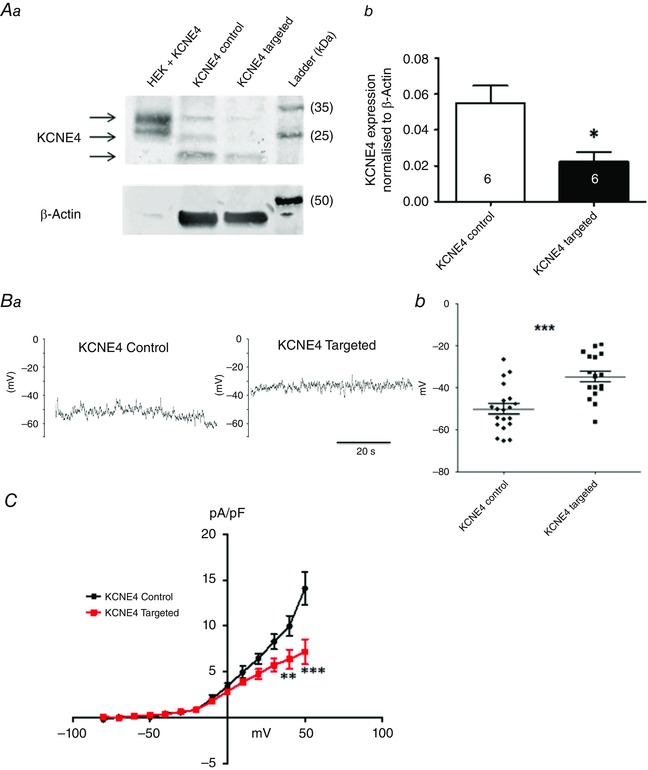
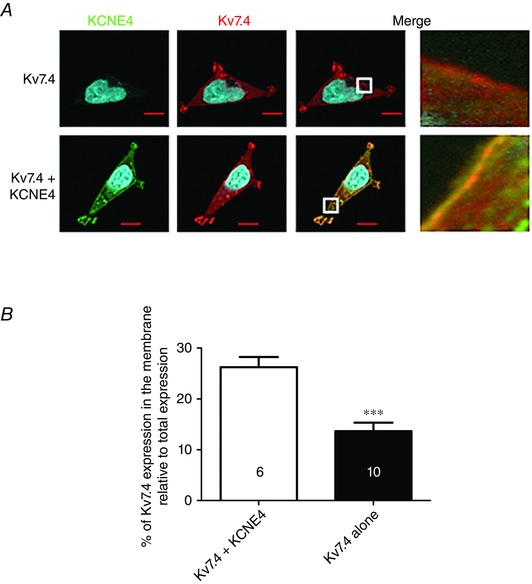
Abstract: The KCNE ancillary subunits (KCNE1-5) significantly alter the expression and function of voltage-gated potassium channels; however, their role in the vasculature has yet to be determined. The present study aimed to investigate the expression and function of the KCNE4 subunit in rat mesenteric arteries and to determine whether it has a functional impact on the regulation of arterial tone by Kv7 channels. In HEK cells expressing Kv7.4, co-expression of KCNE4 increased the membrane expression of Kv7.4 and significantly altered Kv7.4 current properties. Quantitative PCR analysis of different rat arteries found that the KCNE4 isoform predominated and proximity ligation experiments showed that KCNE4 co-localized with Kv7.4 in mesenteric artery myocytes. Morpholino-induced knockdown of KCNE4 depolarized mesenteric artery smooth muscle cells and resulted in their increased sensitivity to methoxamine being attenuated (mean ± SEM EC50 decreased from 5.7 ± 0.63 μm to 1.6 ± 0.23 μm), which coincided with impaired effects of Kv7 modulators. When KCNE4 expression was reduced, less Kv7.4 expression was found in the membrane of the mesenteric artery myocytes. These data show that KCNE4 is consistently expressed in a variety of arteries, and knockdown of the expression product leads to reduced Kv7.4 membrane abundance, a depolarized membrane potential and an augmented response to vasoconstrictors. The present study is the first to demonstrate an integral role of KCNE4 in regulating the function and expression of Kv7.4 in vascular smooth muscle.
© 2015 The Authors. The Journal of Physiology © 2015 The Physiological Society.
Figures
Similar articles
-
Kcne4 Deletion Sex-Dependently Alters Vascular Reactivity.J Vasc Res. 2016;53(3-4):138-148. doi: 10.1159/000449060. Epub 2016 Oct 7. J Vasc Res. 2016. PMID: 27710966 Free PMC article.
-
Uncovered Contribution of Kv7 Channels to Pulmonary Vascular Tone in Pulmonary Arterial Hypertension.Hypertension. 2020 Oct;76(4):1134-1146. doi: 10.1161/HYPERTENSIONAHA.120.15221. Epub 2020 Aug 24. Hypertension. 2020. PMID: 32829658
-
SMIT (Sodium-Myo-Inositol Transporter) 1 Regulates Arterial Contractility Through the Modulation of Vascular Kv7 Channels.Arterioscler Thromb Vasc Biol. 2020 Oct;40(10):2468-2480. doi: 10.1161/ATVBAHA.120.315096. Epub 2020 Aug 13. Arterioscler Thromb Vasc Biol. 2020. PMID: 32787517 Free PMC article.
-
KCNE4 and KCNE5: K(+) channel regulation and cardiac arrhythmogenesis.Gene. 2016 Nov 30;593(2):249-60. doi: 10.1016/j.gene.2016.07.069. Epub 2016 Jul 30. Gene. 2016. PMID: 27484720 Free PMC article. Review.
-
Novel treatment strategies for smooth muscle disorders: Targeting Kv7 potassium channels.Pharmacol Ther. 2016 Sep;165:14-25. doi: 10.1016/j.pharmthera.2016.05.002. Epub 2016 May 11. Pharmacol Ther. 2016. PMID: 27179745 Review.
Cited by
-
Pirfenidone Is a Vasodilator: Involvement of KV7 Channels in the Effect on Endothelium-Dependent Vasodilatation in Type-2 Diabetic Mice.Front Pharmacol. 2021 Jan 12;11:619152. doi: 10.3389/fphar.2020.619152. eCollection 2020. Front Pharmacol. 2021. PMID: 33643042 Free PMC article.
-
KCNQ Potassium Channels as Targets of Botanical Folk Medicines.Annu Rev Pharmacol Toxicol. 2022 Jan 6;62:447-464. doi: 10.1146/annurev-pharmtox-052120-104249. Epub 2021 Sep 13. Annu Rev Pharmacol Toxicol. 2022. PMID: 34516289 Free PMC article. Review.
-
KCNQs: Ligand- and Voltage-Gated Potassium Channels.Front Physiol. 2020 Jun 23;11:583. doi: 10.3389/fphys.2020.00583. eCollection 2020. Front Physiol. 2020. PMID: 32655402 Free PMC article. Review.
-
The agonistic action of URO-K10 on Kv7.4 and 7.5 channels is attenuated by co-expression of KCNE4 ancillary subunit.Korean J Physiol Pharmacol. 2020 Nov 1;24(6):503-516. doi: 10.4196/kjpp.2020.24.6.503. Korean J Physiol Pharmacol. 2020. PMID: 33093272 Free PMC article.
-
Kcne4 deletion sex-specifically predisposes to cardiac arrhythmia via testosterone-dependent impairment of RISK/SAFE pathway induction in aged mice.Sci Rep. 2018 May 29;8(1):8258. doi: 10.1038/s41598-018-26599-8. Sci Rep. 2018. PMID: 29844497 Free PMC article.
References
-
- Andersen MN, Krzystanek K, Petersen F, Bomholtz SH, Olesen SP, Abriel H, Jespersen T & Rasmussen HB (2013). A phosphoinositide 3‐kinase (PI3K)‐serum‐ and glucocorticoid‐inducible kinase 1 (SGK1) pathway promotes Kv7.1 channel surface expression by inhibiting Nedd4‐2 protein. J Biol Chem 288, 36841–36854. - PMC - PubMed
-
- Chadha PS, Zunke F, Zhu HL, Davis AJ, Jepps TA, Olesen SP, Cole WC, Moffatt JD & Greenwood IA (2012). Reduced KCNQ4‐encoded voltage‐dependent potassium channel activity underlies impaired β‐adrenoceptor‐mediated relaxation of renal arteries in hypertension. Hypertension 59, 877–884. - PubMed
-
- Chadha PS, Jepps TA, Carr G, Stott JB, Zhu HL, Cole WC & Greenwood IA (2014). Contribution of Kv7.4/Kv7.5 heteromers to intrinsic and calcitonin gene‐related peptide‐induced cerebral reactivity. Arterioscler Thromb Vasc Biol 34, 887–893. - PubMed
MeSH terms
Substances
Grants and funding
LinkOut - more resources
Full Text Sources
Molecular Biology Databases
Miscellaneous