

doi: 10.1039/c5lc01053e.
Precision chemical heating for diagnostic devices
Affiliations
- PMID: 26503640
- PMCID: PMC10249953
- DOI: 10.1039/c5lc01053e
Item in Clipboard
Precision chemical heating for diagnostic devices
Lab Chip.
.
Abstract
Decoupling nucleic acid amplification assays from infrastructure requirements such as grid electricity is critical for providing effective diagnosis and treatment at the point of care in low-resource settings. Here, we outline a complete strategy for the design of electricity-free precision heaters compatible with medical diagnostic applications requiring isothermal conditions, including nucleic acid amplification and lysis. Low-cost, highly energy dense components with better end-of-life disposal options than conventional batteries are proposed as an alternative to conventional heating methods to satisfy the unique needs of point of care use.
Figures
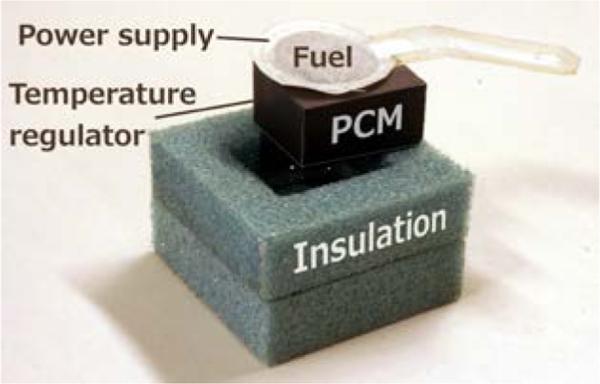
Precision heater designed for use with isothermal NAATs, partially disassembled view. The diagnostic assay sits beneath the PCM block within an appropriate cut-out in the insulation. Top insulation omitted for clarity. A NaCl solution is delivered to this type of power supply via a paper wick from a reservoir (not shown).
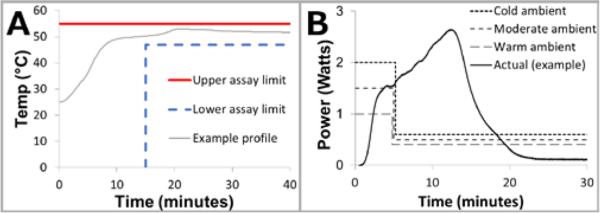
Desired assay temperature tolerances and power curves. A: Assay temperature specifications. The minimum assay temperature here is 47°C, and the temperature must warm up in 15 minutes or less, and hold for 25 minutes. To avoid permanently losing enzyme activity, this assay must never exceed 55°C. An example temperature profile is shown (gray line) that meets these specifications. B: Ideal power profiles to achieve isothermal heating for a range of ambient temperatures, along with an example power profile from a chemical power supply. Cold ambient conditions need more power to warm the system up, in addition to needing more power to account for steady-state heat losses. The non-ideal power profile requires that temperature be additionally regulated by other means (e.g., PCM).
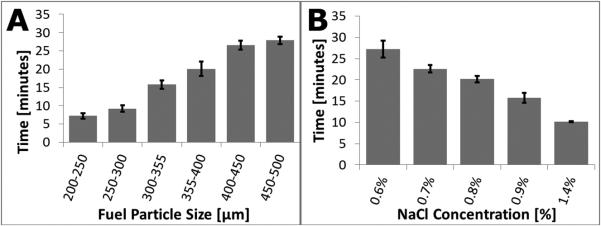
A: Mean time to reach 90% of the peak reaction temperature for various particle sizes of Mg-Fe fuel, n=6 minimum, error bars represent +/− one standard deviation. B: Mean time to reach 90% of the peak reaction temperature is plotted for various saline concentrations. Reaction power output was quantified by monitoring temperature change in a lab-built calorimeter, n=4 minimum, error bars represent +/− one standard deviation.
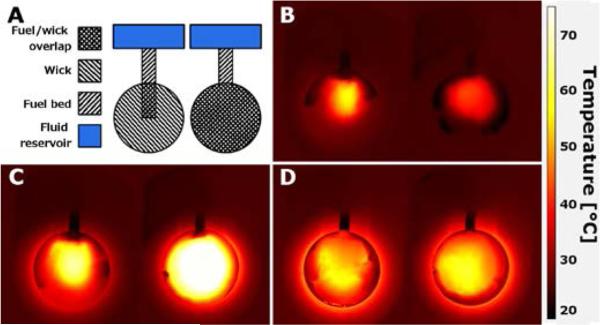
Thermal images of fuel pack with varying wick coverage of the fuel bed. A: Top view schematic comparing fuel pack construction. The partial extension wick (left) extends only a short distance into the fuel, whereas the full profile wick (right) covers the entirety of the fuel bed. B: Temperature at 2 minutes into the reaction. Both fuel packs are at elevated temperature, but the partial wick is at higher temperature where the wick directly contacts the fuel bed. C: Temperature at 5 minutes. The partial wick has a more uneven temperature distribution, whereas the full profile wick is at a more uniform, higher temperature. D: Temperature at 20 minutes. The partial wick may have a more uneven temperature distribution than the full profile wick, but the difference is difficult to distinguish.
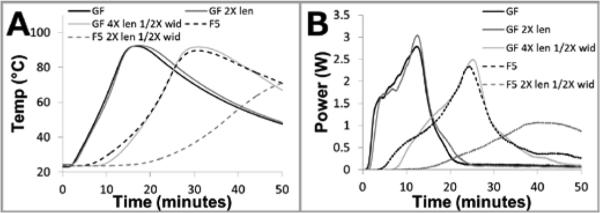
Data from chemical power source characterization test fixture. A: Experimental time vs. temperature for various saline supply wick geometries. Power sources utilizing both glass fiber (GF) and Fusion 5 (F5) membranes can be tuned using membrane length and width. B: Profiles from panel A converted to time vs. power using the numeric model outlined in the Supplementary Information.
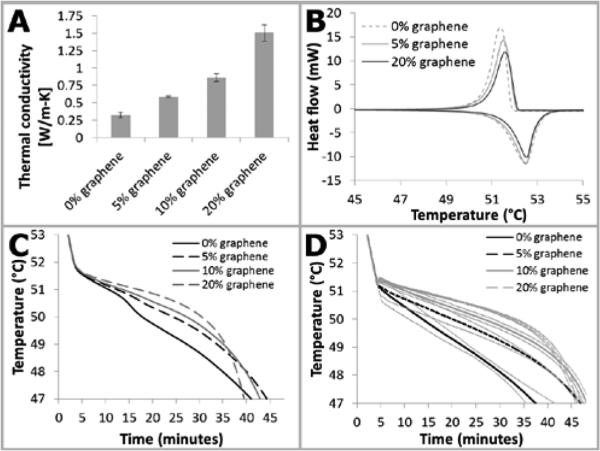
Graphene effect on thermal properties. A: Thermal conductivity of various percentage graphene by weight in PureTemp 53 PCM. Thermal conductivity increases when graphene is added. Data is mean +/− standard deviation, n=6-8. B: DSC curves for graphene/PT53 PCM composites. Addition of graphene displaces PCM, resulting in a lower latent heat capacity of the composite (area under the curve in these plots). C: Modeled effect of varying graphene mass fraction. Lower graphene mass fractions have reduced holdover time. D: Experimental results for varying graphene mass fraction. A similar trend is observed as in the modeled results in panel C. Plotted is data mean +/− one standard deviation, n=2-3.
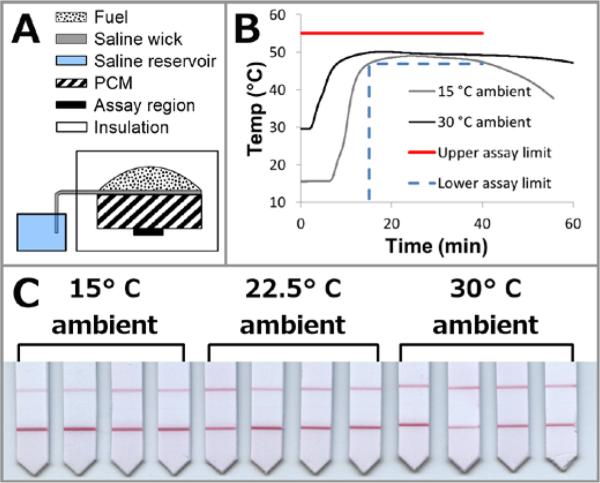
Integrated chemical heater. A: Device schematic (not to scale). The fuel pack sits atop a PCM block, under which is the heated sample zone. A shell of insulation surrounds this assembly, with cut-outs for the fuel pack, PCM, and sample zone. B: Prototype thermal performance. The temperature measured in the assay region is plotted for 15 and 30°C ambient temperatures. Plotted is the data mean, n=3. The assay upper and lower limits are also plotted to visualize device temperature and time requirements. C: Lateral flow detection of iSDA nucleic acid amplification in a prototype device at 15, 22.5, and 30°C ambient temperatures. Lower lines indicate presence of amplified product. Upper lines are biotin controls which bind the gold beads. Negative controls (not shown) indicate specificity of the reaction.
References
-
- Dineva MA, Mahilum-Tapay L, Lee H. Analyst. 2007;132:1193. - PubMed
-
- UNITAID . Tuberculosis: Diagnostic Technology Landscape. World Health Organization; 2012.
-
- Yager P, Domingo GJ, Gerdes J. Annu. Rev. Biomed. Eng. 2008;10:107–44. - PubMed
-
- Weigl BH, Boyle DS, de los Santos T, Peck RB, Steele MS. Expert Rev. Med. Devices. 2009;6:461–4. - PubMed
Publication types
MeSH terms
Grants and funding
LinkOut - more resources
Full Text Sources
Other Literature Sources