. 2016 Nov;16(6):573-582.
doi: 10.1038/tpj.2015.74. Epub 2015 Oct 27.

Computational discovery of transcription factors associated with drug response

Affiliations

Computational discovery of transcription factors associated with drug response

C Hanson et al. Pharmacogenomics J. 2016 Nov.

Abstract

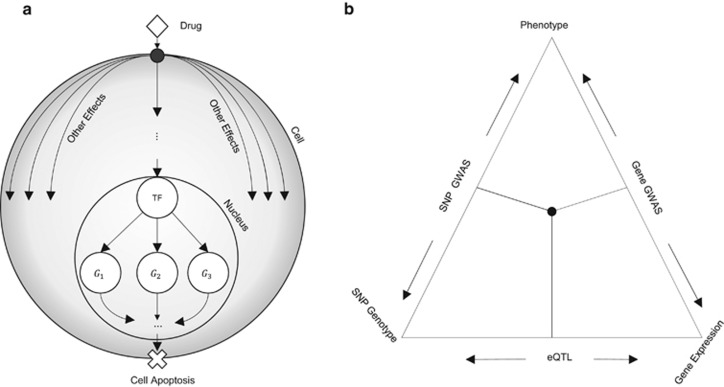
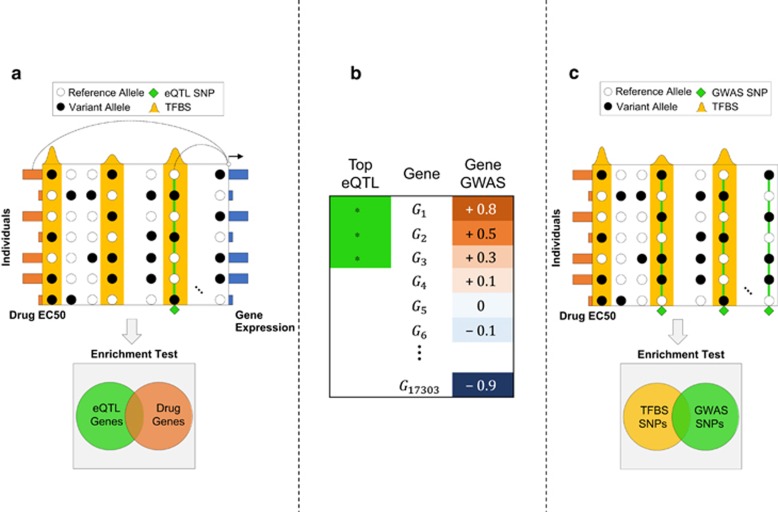
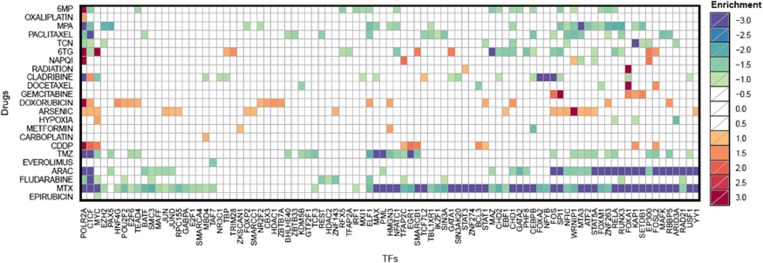
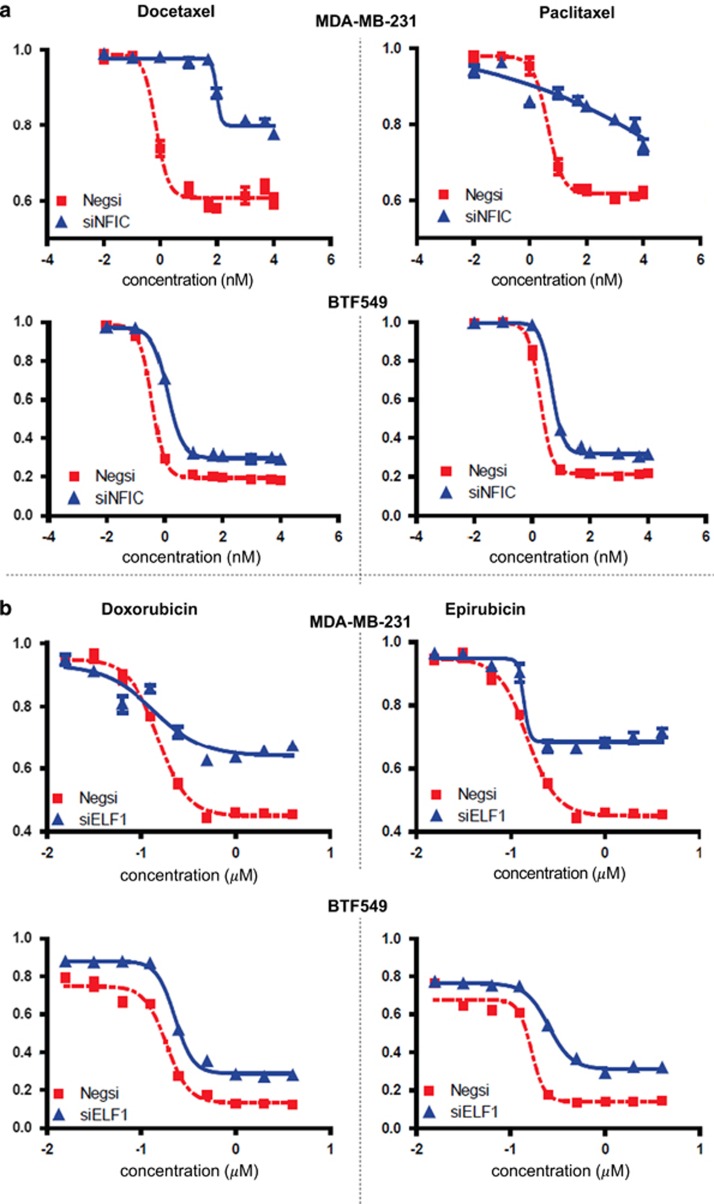
This study integrates gene expression, genotype and drug response data in lymphoblastoid cell lines with transcription factor (TF)-binding sites from ENCODE (Encyclopedia of Genomic Elements) in a novel methodology that elucidates regulatory contexts associated with cytotoxicity. The method, GENMi (Gene Expression iN the Middle), postulates that single-nucleotide polymorphisms within TF-binding sites putatively modulate its regulatory activity, and the resulting variation in gene expression leads to variation in drug response. Analysis of 161 TFs and 24 treatments revealed 334 significantly associated TF-treatment pairs. Investigation of 20 selected pairs yielded literature support for 13 of these associations, often from studies where perturbation of the TF expression changes drug response. Experimental validation of significant GENMi associations in taxanes and anthracyclines across two triple-negative breast cancer cell lines corroborates our findings. The method is shown to be more sensitive than an alternative, genome-wide association study-based approach that does not use gene expression. These results demonstrate the utility of GENMi in identifying TFs that influence drug response and provide a number of candidates for further testing.


Conflict of interest statement

The authors declare no conflict of interest.

Figures

Figure 1
Figure 1
(a) Diagram of how transcription factors (TFs) mediate response to a drug. A drug (diamond) enters the cell and affects multiple cellular processes. One such process involves transport or signal transduction to the nucleus where it alters the transcriptional activity of a TF. Expression of target genes is subsequently altered, potentially resulting in apoptosis. (b) Outline of triangulation procedure proposed in the literature. Each edge of the triangle corresponds to a correlation between two of the three axes of information: drug response, genetic variants and gene expression. Integrative analysis involves intersecting expression quantitative trait locus (eQTL) genes and genome-wide association study (GWAS) genes or eQTL single-nucleotide polymorphisms (SNPs) and GWAS SNPs.
Figure 2
Figure 2
(a) The GENMi (Gene Expression iN the Middle) method. Shown is the 50 kb upstream region of a single gene, with transcription factor-binding site (TFBS; ChIP peaks) in yellow, single-nucleotide polymorphisms (SNPs; circles) and their allelic state (black or white) in a sample of seven individuals, as well as gene expression (blue bars on right) and drug response EC50 values (orange bars on left) in these individuals. The gene is scored in two ways : correlation of the best expression quantitative trait locus (eQTL) SNP (green diamond) coincident with a TFBS and correlation of the gene's expression with drug response (these two correlations are illustrated by lines connecting the two correlated variables). Integrating over all genes, testing the overlap between strongest eQTL genes and genes associated with drug response (enrichment test, bottom) quantifies the extent to which a TF is associated with drug response via cis-regulatory mechanisms. (b) Cartoon of Gene Set Enrichment Analysis (GSEA) used as the enrichment test in GENMi. Genes are ranked according to their correlation with drug response (‘gene GWAS'). The analysis looks at the extent to which a given gene set (in this case genes carrying the strongest eQTLs coincident with the TFBS) are enriched near the top or bottom of the ranked list. Here, the gene set is strongly associated with genes positively associated with drug EC50 values. (c) Baseline method that does not use expression data. Shown are SNPs (columns) distributed throughout the genome within TFBS (yellow peaks) and outside. Genome-wide association study (GWAS) SNPs (green diamonds) correlated with drug response across individuals (rows) are tested for enrichment with within-TFBS SNPs to determine whether a TF is associated with drug response.
Figure 3
Figure 3
Significant (transcription factor (TF), treatment) associations. Shown are the log-transformed false discovery rate (FDR) values for all associations meeting FDR ≤0.1. The green–blue range refers to enrichment for genes whose expression negatively correlates with cytotoxicity, and the yellow–red range indicates enrichment of genes whose expression positively correlates with cytotoxicity. The yellow–red log-transformed FDR values are multiplied by negative 1, creating the −3 to 3 range in the legend enrichment. Anything with an FDR ≥0.1 is shown as white.
Figure 4
Figure 4
(a) Dosage–response curves for the transcription factor (TF) NFIC across two drugs, docetaxel (left) and paclitaxel (right), and two cell lines, MDA-MB-231 and BTF549. Each plot shows significant increase in resistance to the drug upon knockdown of NFIC compared with normal response of the cells, using a two-tailed paired t-test. (b) Dosage–response curves for the TF ELF1 across two drugs, doxorubicin (left) and epirubicin (right), and two cell lines, MDA-MB-231 and BTF549. Each plot shows significant increase in resistance to the drug upon knockdown of NFIC compared with normal response of the cells, using a two-tailed paired t-test.

References

    1. Encode Project Consortium, Birney E, Stamatoyannopoulos JA, Dutta A, Guigo R, Gingeras TR et al. Identification and analysis of functional elements in 1% of the human genome by the ENCODE pilot project. Nature 2007; 447: 799–816. - PMC - PubMed
    1. Wang L, Weinshilboum RM. Pharmacogenomics: candidate gene identification, functional validation and mechanisms. Hum Mol Genet 2008; 17: R174–R179. - PMC - PubMed
    1. Wang L, McLeod HL, Weinshilboum RM. Genomics and drug response. N Engl J Med 2011; 364: 1144–1153. - PMC - PubMed
    1. Moen EL, Godley LA, Zhang W, Dolan ME. Pharmacogenomics of chemotherapeutic susceptibility and toxicity. Genome Med 2012; 4: 90. - PMC - PubMed
    1. Wheeler HE, Dolan ME. Lymphoblastoid cell lines in pharmacogenomic discovery and clinical translation. Pharmacogenomics 2012; 13: 55–70. - PMC - PubMed

Publication types

MeSH terms