. 2016 Jan;15(1):45-56.
doi: 10.1074/mcp.M114.047480. Epub 2015 Oct 26.

Integrated Bottom-Up and Top-Down Proteomics of Patient-Derived Breast Tumor Xenografts

Affiliations

Integrated Bottom-Up and Top-Down Proteomics of Patient-Derived Breast Tumor Xenografts

Ioanna Ntai et al. Mol Cell Proteomics. 2016 Jan.

Abstract

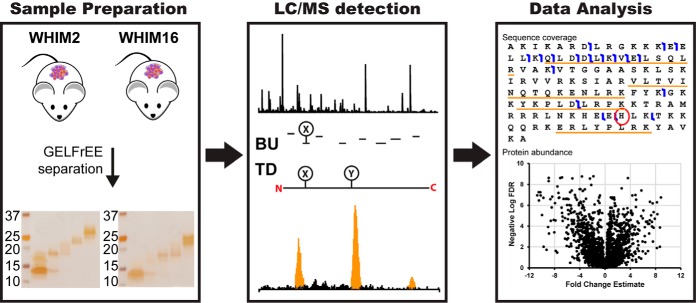
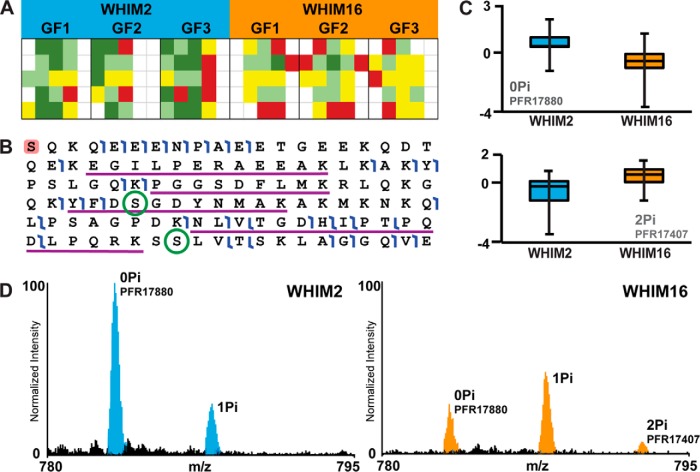
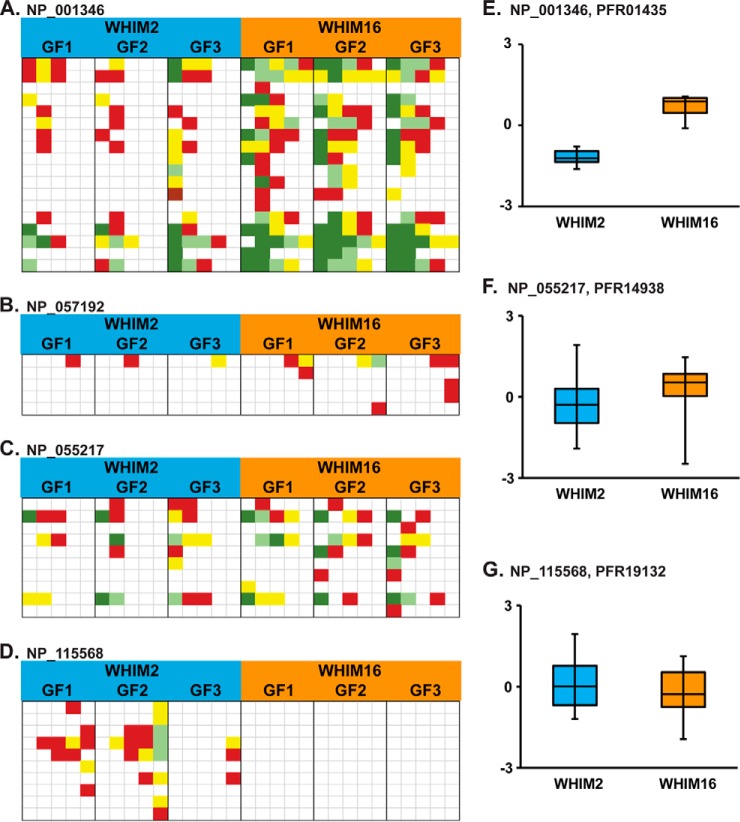
Bottom-up proteomics relies on the use of proteases and is the method of choice for identifying thousands of protein groups in complex samples. Top-down proteomics has been shown to be robust for direct analysis of small proteins and offers a solution to the "peptide-to-protein" inference problem inherent with bottom-up approaches. Here, we describe the first large-scale integration of genomic, bottom-up and top-down proteomic data for the comparative analysis of patient-derived mouse xenograft models of basal and luminal B human breast cancer, WHIM2 and WHIM16, respectively. Using these well-characterized xenograft models established by the National Cancer Institute's Clinical Proteomic Tumor Analysis Consortium, we compared and contrasted the performance of bottom-up and top-down proteomics to detect cancer-specific aberrations at the peptide and proteoform levels and to measure differential expression of proteins and proteoforms. Bottom-up proteomic analysis of the tumor xenografts detected almost 10 times as many coding nucleotide polymorphisms and peptides resulting from novel splice junctions than top-down. For proteins in the range of 0-30 kDa, where quantitation was performed using both approaches, bottom-up proteomics quantified 3,519 protein groups from 49,185 peptides, while top-down proteomics quantified 982 proteoforms mapping to 358 proteins. Examples of both concordant and discordant quantitation were found in a ∼60:40 ratio, providing a unique opportunity for top-down to fill in missing information. The two techniques showed complementary performance, with bottom-up yielding eight times more identifications of 0-30 kDa proteins in xenograft proteomes, but failing to detect differences in certain posttranslational modifications (PTMs), such as phosphorylation pattern changes of alpha-endosulfine. This work illustrates the potency of a combined bottom-up and top-down proteomics approach to deepen our knowledge of cancer biology, especially when genomic data are available.


Figures

Fig. 1.
Fig. 1.
Workflow for the qualitative and quantitative analysis of CompRef tumor xenografts by bottom-up and top-down.
Fig. 2.
Fig. 2.
Protein identifications in WHIM2 and WHIM16. (A) TD spectrum of gamma-synuclein displaying the distinctive pattern of a heterozygote genotype at this locus, and sequence of gamma-synuclein including fragment ions (flags) detected by TD and peptide sequences (underlined) detected by BU. The highlighted N-terminal amino acid indicates an N-terminal acetylation. The cSNP E110V is circled. Both technologies provided evidence of the cSNP. (B) TD spectrum of ribosomal protein L35 displaying the distinctive pattern of a heterozygote genotype at this locus, and sequence of ribosomal protein L35 including fragment ions (flags) detected by TD and peptide sequences (underlined) detected by BU. The cSNP N101H is circled. Only TD provided evidence of the cSNP.
Fig. 3.
Fig. 3.
Summary of quantitative results from Study 3. (A) Volcano plot obtained using label-free TD quantitative analysis from comparison of 0–30kDa proteins in WHIM2 and WHIM16 (Study 2), (B) Volcano plot obtained using label-free TD quantitative analysis from comparison of 0–30kDa proteins in WHIM2 and WHIM16 (Study 3), (C) Volcano plot obtained using label-free BU quantitative analysis from comparison of 0–30kDa proteins in WHIM2 and WHIM16 (Study 3), (D) Correlation of BU and TD fold change estimates for significantly different entities.
Fig. 4.
Fig. 4.
Differential expression of alpha-endosulfine. (A) Bottom-up heatmap illustrating number of alpha-endosulfine peptides identified in each replicate. Each row represents a separate peptide reporting uniquely on alpha-endosulfine, while columns in the map represent separate LC-MS/MS runs. Red represents one spectral count in the run, yellow two, light green three, and dark green four or more spectral counts. (B) Sequence of alpha-endosulfine including fragment ions (flags) detected by TD and peptide sequences (underlined) detected by BU. Two phosphorylation sites detected by TD are circled. The highlighted N-terminal amino acid indicates an N-terminal acetylation. (C) Boxplots illustrating abundance differences of alpha-endosulfine in WHIM2 (blue) and WHIM16 (orange) samples. The box in the boxplots show the median, first and third quartiles of all MS1 intensities detected for the protein. The bars show the range of the observed data. (D) Mass spectrum of alpha-endosulfine showing phosphorylation pattern changes of alpha-endosulfine in the two WHIM samples.
Fig. 5.
Fig. 5.
Discordant examples of differential expression profiles as measured by BU and TD. Panels A–D show heatmaps generated from BU spectral count data, while panels E–G contain corresponding boxplots from TD MS1 intensity data. Each row of the BU heatmaps represents a separate peptide reporting uniquely on the corresponding protein, while columns in the map represent separate LC-MS/MS runs. Red represents one spectral count in the run, yellow two, light green three, and dark green four or more spectral counts. The box in the boxplots show the median, first, and third quartiles of all MS1 intensities detected for the protein. The bars show the range of the observed data. Panels 5 A and E represent d-dopachrome decarboxylase (NP_001346) BU and TD, respectively; C and F represent cytochrome b-c1 complex subunit 8 (NP_055217), while D and G represent protein phosphatase 1 regulatory subunit 1B (NP_115568). Panel B shows BU data for androgen-induced gene 1 (NP_057192).

References

    1. Balmain A., Gray J., and Ponder B. (2003) The genetics and genomics of cancer. Nat. Genet. 33, 238–244 - PubMed
    1. Zhang B., Wang J., Wang X., Zhu J., Liu Q., Shi Z., Chambers M. C., Zimmerman L. J., Shaddox K. F., Kim S., Davies S. R., Wang S., Wang P., Kinsinger C. R., Rivers R. C., Rodriguez H., Townsend R. R., Ellis M. J., Carr S. A., Tabb D. L., Coffey R. J., Slebos R. J., and Liebler D. C. (2014) Proteogenomic characterization of human colon and rectal cancer. Nature 513, 382–387 - PMC - PubMed
    1. Zhang Z., Wu S., Stenoien D. L., and Pasa-Tolic L. (2014) High-throughput proteomics. Annu. Rev. Anal. Chem. 7, 427–454 - PubMed
    1. Lu B., Motoyama A., Ruse C., Venable J., and Yates J. R. 3rd. (2008) Improving protein identification sensitivity by combining MS and MS/MS information for shotgun proteomics using LTQ-Orbitrap high mass accuracy data. Anal. Chem. 80, 2018–2025 - PMC - PubMed
    1. Wiśniewski J. R., Zougman A., and Mann M. (2009) Combination of FASP and StageTip-based fractionation allows in-depth analysis of the hippocampal membrane proteome. J. Proteome Res. 8, 5674–5678 - PubMed

Publication types