. 2016 Jan 1;109(1):115-30.
doi: 10.1093/cvr/cvv243. Epub 2015 Oct 26.

HIF-2α-mediated induction of pulmonary thrombospondin-1 contributes to hypoxia-driven vascular remodelling and vasoconstriction

Affiliations

HIF-2α-mediated induction of pulmonary thrombospondin-1 contributes to hypoxia-driven vascular remodelling and vasoconstriction

David Labrousse-Arias et al. Cardiovasc Res. .

Erratum in

Abstract

Aims: Hypoxic conditions stimulate pulmonary vasoconstriction and vascular remodelling, both pathognomonic changes in pulmonary arterial hypertension (PAH). The secreted protein thrombospondin-1 (TSP1) is involved in the maintenance of lung homeostasis. New work identified a role for TSP1 in promoting PAH. Nonetheless, it is largely unknown how hypoxia regulates TSP1 in the lung and whether this contributes to pathological events during PAH.

Methods and results: In cell and animal experiments, we found that hypoxia induces TSP1 in lungs, pulmonary artery smooth muscle cells and endothelial cells, and pulmonary fibroblasts. Using a murine model of constitutive hypoxia, gene silencing, and luciferase reporter experiments, we found that hypoxia-mediated induction of pulmonary TSP1 is a hypoxia-inducible factor (HIF)-2α-dependent process. Additionally, hypoxic tsp1(-/-) pulmonary fibroblasts and pulmonary artery smooth muscle cell displayed decreased migration compared with wild-type (WT) cells. Furthermore, hypoxia-mediated induction of TSP1 destabilized endothelial cell-cell interactions. This provides genetic evidence that TSP1 contributes to vascular remodelling during PAH. Expanding cell data to whole tissues, we found that, under hypoxia, pulmonary arteries (PAs) from WT mice had significantly decreased sensitivity to acetylcholine (Ach)-stimulated endothelial-dependent vasodilation. In contrast, hypoxic tsp1(-/-) PAs retained sensitivity to Ach, mediated in part by TSP1 regulation of pulmonary Kv channels. Translating these preclinical studies, we find in the lungs from individuals with end-stage PAH, both TSP1 and HIF-2α protein expression increased in the pulmonary vasculature compared with non-PAH controls.

Conclusions: These findings demonstrate that HIF-2α is clearly implicated in the TSP1 pulmonary regulation and provide new insights on its contribution to PAH-driven vascular remodelling and vasoconstriction.

Keywords: Endothelial cells; Fibroblasts; HIF-2α; Hypoxia; Pulmonary arterial hypertension; Pulmonary artery; Smooth muscle cells; Thrombospondin-1.


Figures

Figure 1
Figure 1
Hypoxia-mediated induction of pulmonary TSP1 parallels stabilization of HIF-2α. (A) Quantitative RT–PCR analysis was performed to determine TSP1 mRNA expression levels in lung samples from WT and tsp1−/− mice exposed to normoxia (Nx) or hypoxia (Hp) (10% O2) for the indicated time points. mRNA levels are expressed as fold change over WT in normoxic conditions and controlled with β-Actin as the housekeeping gene. The hypoxia reporter gene phd3 was analysed in the same samples as a control of hypoxic stress. Statistical analysis between different conditions was made using a murine type stratified one-way ANOVA test followed by Bonferroni's post hoc test, *P < 0.05, **P < 0.01; #P-trend < 0.05. Student's t-test was made between WT Hp 24 h and tsp1−/− Hp 24 h. Results are expressed as means ± S.E.M. (n = 4), ns (not significant). (B) Protein levels in lung samples from WT and tsp1−/− mice challenged with normoxia (Nx) or hypoxia (Hp) were detected via western blot probed against TSP1, HIF-2α, and α-Tubulin as a loading control. Quantification of TSP1 and HIF-2α bands was done by densitometry and controlled with α-Tubulin. Protein levels are expressed as fold change over WT in normoxic conditions. Statistical comparisons between different conditions were made using a murine type stratified Kruskal–Wallis followed by Dunn's post hoc test, *P < 0.05. **P < 0.01. #P-trend <0.05. Mann–Whitney test was made between WT Hp 24 h and tsp1−/− Hp 24 h. Results are expressed as means ± S.E.M. (n = 4), ns (not significant).
Figure 2
Figure 2
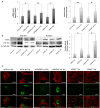
Hypoxia up-regulates TSP1 in pulmonary vascular and non-vascular cells. (A) Pulmonary murine fibroblasts (mFib) and murine PASMC (mPASMC) from WT, and human PAECs (hPAECs) were exposed to normoxia (Nx) or hypoxia (Hp) (1% O2) for 24 h and changes in mRNA levels determined by RT–PCR. TSP1 mRNA levels are expressed as fold change over normoxic conditions and controlled with β-Actin as the housekeeping gene. Average ± S.E.M. of n = 3 performed is shown. *P < 0.05, **P< 0.01. Student's t-test, ns (not significant). (B) Protein levels from mFib, mPASMC, hPAEC, and hPASMC exposed to normoxia (Nx) or hypoxia (Hp) (1% O2) for 24 h were detected by western blot probed against TSP1, HIF-2α, and α-Tubulin as a loading control. Densitometric analysis was performed to quantify TSP1 bands and levels were controlled with α-Tubulin and expressed as fold change over Nx. Average ± S.E.M. of n = 3 performed is shown. *P < 0.05. Student's t-test, ns (not significant). (C) Visualization of TSP1 (green) and F-Actin (red) in mFib, mPASMC, and hPAEC grown on fibronectin (5 μg/mL)-coated coverslips. Images shown are representative of three experiments. Bars, 50 μm.
Figure 3
Figure 3
HIF-2α regulates TSP1 levels in the lung. (A) Quantitative RT–PCR analysis was performed to determine TSP1 mRNA expression levels in lung samples from WT, VHL deficient (vhl−/−), VHL/HIF-2α (vhl−/−/hif-2α−/−), and VHL/HIF-1α (vhl−/−/hif-1α−/−) double-deficient mice. mRNA levels are expressed as fold change over WT and controlled with β-Actin as the housekeeping gene. Average ± S.E.M. of n = 4 performed is shown. Statistical comparisons between different conditions were made using Kruskal–Wallis followed by a Dunn's post hoc test, *P < 0.05, ns (not significant). (B) Protein levels in lung samples from WT, vhl−/−, vhl−/−/hif-2α−/−, and hif-2α−/− mice under normoxia (Nx) or hypoxia (Hp) (10% O2) for 3 days were analysed by western blot. Representative images of three experiments are shown. (C) TSP1, HIF-1α, and HIF-2α mRNA expression levels were analysed in hPAEC untreated or transfected with scrambled (scr), HIF-1α or HIF-2α siRNA and then exposed to Nx or Hp (1% O2) for 24 h. Statistical comparisons between different conditions were made using a cell type stratified Mann–Whitney's test, *P < 0.05, **P < 0.01. Mann–Whitney's test was made between different cell types in Hp, *P < 0.05 was considered significant, n = 4. (D) Western blot of hPAEC and hPASMC, untreated or transfected with scrambled (scr), HIF-1α or HIF-2α siRNA and then exposed to Nx or Hp (1% O2) for 24 h, probed against TSP1, HIF-1α, HIF-2α, and α-Tubulin or β-Actin as a loading control. Representative images of five experiments are shown.
Figure 4
Figure 4
Lung samples of PAH patients. Western blot analysis of lysates of fifth-order PAs (A) and lung parenchyma (B) from non-PAH and PAH human lungs was performed against TSP1, HIF-1α, HIF-2α, and α-Tubulin or β-Actin as a loading control. Representative blots and densitometry (average ± S.E.M.) are presented as the mean ratio of target protein to α-Tubulin or β-Actin, respectively (n = 8 normal and 15 PAH samples); Mann–Whitney test corrected by Bonferroni's post hoc test was performed, *P < 0.05.
Figure 5
Figure 5
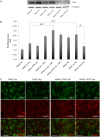
HIF-2α functionally binds to HREs of the tsp1 proximal promoter sequence. (A) Blast sequence alignment of the tsp1 proximal promoter sequence of different mammalian species containing conserved HRE sites (sites 1 and 2), and boxes mark core sequences of HRE sites. (B) Luciferase reporter activity assay of TSP1 HREs. Equal numbers of CHO.K1 cells were plated in 24-well plate (5 × 10⁵ cells per well) and cotransfected with PGL4.23-3xHRE1 (HRE site 1) or PGL4.23-3xHRE2 (HRE site 2) and with pRV-GFP-HIF-1α(P-A)2 (HIF-1α(P-A)*2) or pRV-GFP-HIF-2α(P-A)2 (HIF-2α(P-A)*2) or pRV-GFP empty vector as a control. pRL-SV40 (Renilla) was included in all transfections as a luciferase internal control. Twenty-four h after cotransfection cells were lysed and analysed for luciferase activity. Results are expressed as means ± S.E.M. of relative light units (RLU) normalized to control. Statistical comparisons between different conditions were made using Kruskal–Wallis, followed by a Dunn's post hoc test, **P < 0.01, ***P < 0.001, n = 8.
Figure 6
Figure 6
TSP1 stimulates de-adhesion to promote hypoxia-mediated migration of mFib and mPASMC. Migration of mFib (A) and mPASMC (B) from WT and tsp1−/− mice was assessed in transwell assays. Cells (12 × 103 cells/well) were serum-starved for 3 h and then allowed to migrate for 7 h at 37°C and 5% CO2 under normoxia (Nx) or hypoxia (Hp) (1% O2). As chemoattractant, DMEM with 20% FBS was added into the lower chamber, and basal media was used as a negative control. The number of cells migrated are represented as fold ± S.E.M. over WT under normoxic conditions. Statistical comparisons between different conditions were made using a murine stratified Student's t-test, *P < 0.05 **P < 0.01. Student's t-test was made between WT Hp 24 h and tsp1−/− Hp 24 h, *P < 0.05 was considered significant, n = 4, ns (not significant). (C) Visualization of cell adhesion plaques. mFib and mPASMC grown on fibronectin (5 μg/ml)-coated coverslips were cultured under Nx or Hp (1% O2) for 24 h, then fixed, permeabilized, and incubated with mAb to Vinculin (VCL), visualized with Alexa 488 (green), together with Alexa Fluor 568 phalloidin (red) to stain actin filaments (F-Actin). Images shown are representative of three experiments and at least 30 cells per condition. Bars, 50 μm.
Figure 7
Figure 7
Hypoxia-mediated increase in TSP1 destabilizes hPAEC junctions and increases paracellular permeability. hPAECs were untreated or transfected with scrambled (scr) or specific TSP1 siRNA (siTSP1) and 24 h after transfection cells were exposed to normoxia (Nx) or hypoxia (Hp) (1% O2). (A) Analysis of TSP1 and α-Tubulin protein levels by western blot, and images shown are representative of four experiments. (B) hPAEC monolayers were exposed to normoxia (Nx) or hypoxia (Hp) (1% O2) or treated with TSP1 exogenous (20 µg/mL) for 7 h, and flux of FITC-dextran 70 kDa (FD-70) across hPAEC monolayers for 1 h. Fluorescence was quantified with a spectrophotometer at 515 nm. Average ± S.E.M. of n = 6 performed is shown. Statistical comparisons between different conditions were made using a cell type stratified one-way ANOVA test followed by Bonferroni's post hoc test, *P < 0.05, **P < 0.01. (C) IF of hPAEC with ZO-1-Alexa 488 (green) and Alexa Fluor 568 phalloidin (red) to visualize actin filaments (F-Actin). Two days after transfection cells were grown on fibronectin (2 μg/mL)-coated coverslips and cultured under Nx or Hp (1% O2) for 24 h. Images shown are representative of three experiments. AU, arbitrary units.
Figure 8
Figure 8
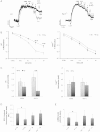
TSP1 limits hypoxia-mediated vascular responses in PAs. Vascular responses were analysed in endothelium-intact PAs from WT or tsp1−/− mice previously incubated for 16 h under normoxic (Nx) or hypoxic (Hp) (1% O2) conditions. Representative traces (A) and average values (B) of the ACh-induced relaxation (ACh) in serotonin (5-HT)-stimulated PAs. (C) Average values of the contraction induced by XE991 (0.3 µmol/L) and DPO-1 (1 µmol/L), Kv7 and Kv1.5 channels inhibitors, respectively. (D) Life cell calcium measurement with cytosolic calcium probe Fluo-4 AM. Average values of DPO-1-induced fluorescence (2 µmol/L) in mPASMC from WT or tsp1−/− mice previously incubated for 16 h under normoxic (Nx) or hypoxic (Hp) (1% O2) conditions. Statistical comparisons in (A–D) were made using two-way ANOVA, followed by Bonferroni's post hoc test; *P < 0.05, **P < 0.01. Results are expressed as means ± S.E.M. (n = 10). AU, arbitrary units. (E) Quantitative RT–PCR analysis was performed to determine Kv1.5 mRNA expression levels in mPASMC from WT or tsp1−/− mice under normoxia (Nx) or hypoxia (Hp) (1% O2) for 24 h. mRNA levels are expressed as fold change over WT in normoxic conditions and controlled with β-Actin as the housekeeping gene. Results are expressed as means ± S.E.M. Statistical comparisons between different conditions were made using a mice type stratified Student's t-test, *P < 0.05, n = 3.

Comment in

References

    1. Zamanian RT, Kudelko KT, Sung YK, de Jesus Perez V, Liu J, Spiekerkoetter E. Current clinical management of pulmonary arterial hypertension. Circ Res 2014;115:131–147. - PMC - PubMed
    1. Grunig E, Dehnert C, Mereles D, Koehler R, Olschewski H, Bartsch P, Janssen B. Enhanced hypoxic pulmonary vasoconstriction in families of adults or children with idiopathic pulmonary arterial hypertension. Chest 2005;128:630S–633S. - PubMed
    1. Crosswhite P, Sun Z. Nitric oxide, oxidative stress and inflammation in pulmonary arterial hypertension. J Hypertens 2010;28:201–212. - PMC - PubMed
    1. Lakshminrusimha S, Wiseman D, Black SM, Russell JA, Gugino SF, Oishi P, Steinhorn RH, Fineman JR. The role of nitric oxide synthase-derived reactive oxygen species in the altered relaxation of pulmonary arteries from lambs with increased pulmonary blood flow. Am J Physiol Heart Circ Physiol 2007;293:H1491–H1497. - PMC - PubMed
    1. Best DH, Austin ED, Chung WK, Elliott CG. Genetics of pulmonary hypertension. Curr Opin Cardiol 2014;29:520–527. - PubMed

Publication types

Substances