. 2016 Jan 1;291(1):342-54.
doi: 10.1074/jbc.M115.683722. Epub 2015 Oct 26.

Kinetically Defined Mechanisms and Positions of Action of Two New Modulators of Glucocorticoid Receptor-regulated Gene Induction

Affiliations

Kinetically Defined Mechanisms and Positions of Action of Two New Modulators of Glucocorticoid Receptor-regulated Gene Induction

Madhumita A Pradhan et al. J Biol Chem. .

Abstract

Most of the steps in, and many of the factors contributing to, glucocorticoid receptor (GR)-regulated gene induction are currently unknown. A competition assay, based on a validated chemical kinetic model of steroid hormone action, is now used to identify two new factors (BRD4 and negative elongation factor (NELF)-E) and to define their sites and mechanisms of action. BRD4 is a kinase involved in numerous initial steps of gene induction. Consistent with its complicated biochemistry, BRD4 is shown to alter both the maximal activity (Amax) and the steroid concentration required for half-maximal induction (EC50) of GR-mediated gene expression by acting at a minimum of three different kinetically defined steps. The action at two of these steps is dependent on BRD4 concentration, whereas the third step requires the association of BRD4 with P-TEFb. BRD4 is also found to bind to NELF-E, a component of the NELF complex. Unexpectedly, NELF-E modifies GR induction in a manner that is independent of the NELF complex. Several of the kinetically defined steps of BRD4 in this study are proposed to be related to its known biochemical actions. However, novel actions of BRD4 and of NELF-E in GR-controlled gene induction have been uncovered. The model-based competition assay is also unique in being able to order, for the first time, the sites of action of the various reaction components: GR < Cdk9 < BRD4 ≤ induced gene < NELF-E. This ability to order factor actions will assist efforts to reduce the side effects of steroid treatments.

Keywords: EC50; accelerator; cyclin-dependent kinase (CDK); decelerator; gene expression; glucocorticoid receptor; kinetically defined activity; steroid hormone; transactivation competition assay; transcription factor.


Figures

FIGURE 1.
FIGURE 1.
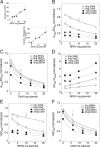
Plots of dose-response parameters for varying concentrations of BRD4 and CDK9. Experiments were conducted with triplicate samples of U2OS cells that were transiently transfected with the indicated concentrations of BRD4 and CDK9 plasmids and treated with EtOH and three concentrations of Dex, as described under “Experimental Procedures.” A, graphs of density of Western blots with the indicated amounts of transfected plasmid, after normalization to internal β-actin intensities, without (top; BRD4) or with (bottom; CDK9) subtraction of endogenous protein signal. Error bars, range of duplicate samples. Average plots of Amax/EC50 versus BRD4 (B) and CDK9 (C), of EC50/Amax versus BRD4 (D), and of 1/EC50 versus BRD4 (E) and CDK9 (F) were obtained by first normalizing the data to the value for the lowest amount of BRD4 and CDK9 and then averaging and plotting the values (n = 6, mean ± S.E.). BIC analysis of the individual curves for EC50/Amax versus BRD4 (Fig. 1D) revealed a quadratic fit, indicative of a second site of action, only with 20 ng of CDK9 plasmid (BIC value = 3.57 for quadratic versus 5.97 for linear fit).
FIGURE 2.
FIGURE 2.
Plots of dose-response parameters for varying concentrations of BRD4 and dnCDK9. Experiments were conducted as in Fig. 1. A, graph of density of Western blots with the indicated amounts of transfected dnCDK9 plasmid, after normalization to internal β-actin intensities, with subtraction of endogenous protein signal. Error bars, range of duplicate samples. Average plots of Amax/EC50 versus BRD4 (B) and dnCDK9 (C), of EC50/Amax versus BRD4 (D), and of 1/EC50 versus BRD4 (E) and dnCDK9 (F) were obtained by first normalizing the data to the value for the lowest amount of BRD4 and dnCDK9 and then averaging and plotting the values (n = 6, mean ± S.E.).
FIGURE 3.
FIGURE 3.
Plots of dose-response parameters for varying concentrations of mtBRD4 and CDK9. Experiments were conducted as in Fig. 1. A, graph of density of Western blots with the indicated amounts of transfected mtBRD4 plasmid, after normalization to internal β-actin intensities, without subtraction of endogenous protein signal. Error bars, range of duplicate samples. Average plots of Amax/EC50 (B), 1/EC50 (C), and EC50/Amax (D) versus mtBRD4 were obtained by first normalizing the data to the value for the lowest amount of BRD4 and dnCDK9 and then averaging and plotting the values (n = 3, mean ± S.E.).
FIGURE 4.
FIGURE 4.
Plots of dose-response parameters for varying concentrations of mtBRD4 and dnCDK9. Experiments were conducted as in Fig. 1. Average plots of Amax/EC50 versus mtBRD4 (A) and dnCDK9 (B) and of EC50/Amax versus mtBRD4 (C) were obtained by first normalizing the data to the value for the lowest amount of BRD4 and dnCDK9 and then averaging and plotting the values (n = 3, mean ± S.E. (error bars)).
FIGURE 5.
FIGURE 5.
Wild type and mutant BRD4 have identical activities in U2OS cells. Experiments were conducted as in Fig. 1. Average plots of 1/EC50 and Amax/EC50 versus wtBRD4 (A and C) and versus mtBRD4 (B and D) were obtained by first normalizing the data to the value for the lowest amount of wtBRD4 and mtBRD4 and then averaging and plotting the values (n = 3, mean ± S.E. (error bars)). E, plot of EC50/Amax versus total amount of added BRD4 protein. For the experiments in A–D, the total amount of BRD4 protein in each of the 16 samples was calculated based on the Western blot data indicating that the expression of mtBRD4 plasmid is 2.1-fold that of the wtBRD4 plasmid. The values of EC50/Amax versus the total amount of expressed BRD4 protein were then plotted (n = 3, mean ± S.E.).
FIGURE 6.
FIGURE 6.
BRD4 interacts with NELF-E. A, BRD4 was immunoprecipitated from HeLa nuclear extract using anti-BRD4 antibody and immunoblotted with anti-NELF-E and anti-CDK9 antibodies. B, BRD4 directly interacts with NELF-E. Recombinant purified NELF-E (0.1 and 0.3 μg) was pulled down with 0.25 μg of FLAG-BRD4 immobilized on anti-FLAG M2 agarose beads. NELF-E alone (0.3 μg) with anti-FLAG beads in lane 1 serves as a negative control.
FIGURE 7.
FIGURE 7.
Plots of dose-response parameters for varying concentrations of BRD4 and NELF-E. Experiments were conducted as in Fig. 1. A, graph of density of Western blots with the indicated amounts of transfected NELF-E plasmid, after normalization to internal β-actin intensities, without subtraction of endogenous protein signal. Error bars, range of duplicate samples. Average plots of Amax/EC50 versus wtBRD4 (B) and NELF-E (C), of EC50/Amax versus wtBRD4 (D), and of the reciprocal of the y axis intercept in C versus wtBRD4 were obtained by first normalizing the data to the value for the lowest amount of BRD4 and NELF-E and then averaging and plotting the values (n = 5, mean ± S.E. (error bars); n = 2 and 3 for 25 and 40 ng of BRD4, respectively). It should be noted that the lowest amount of BRD4 used was 0 ng and that all data were normalized to the combination of 0 ng of BRD4 and 0 ng of NELF-E. However, this point was not plotted.
FIGURE 8.
FIGURE 8.
Plots of dose-response parameters for varying concentrations of wild type or mutant BRD4 and TIF2. Experiments were conducted as in Fig. 1. Average plots of Amax/EC50 (A and C) and EC50/Amax (B and D) versus wtBRD4 (A and B) and mtBRD4 (C and D) were obtained by first normalizing the data to the value for the lowest amount of BRD4 and TIF2 and then averaging and plotting the values (n = 2–4, mean ± S.E. (error bars)).
FIGURE 9.
FIGURE 9.
Correlation of kinetic and biochemical actions of factors contributing to GR induction of gene expression. A, ordering of factors in reaction scheme for induction of luciferase activity from synthetic reporter (GREtkLUC) by steroid-bound receptor (GR). The position of the CLS, which is the site of action of GREtkLUC, and positions of action of BRD4, mtBRD4, CDK9, dnCDK9, NELF-E, and TIF2, as determined by the data of Figs. 1–8, are indicated at the top. Also included are the sites of action, as determined from earlier work in the same cell system, of GR and NELF-A and -B (20). A, accelerator; C, competitive decelerator; C,2, competitive decelerator at two sites; C,2*, competitive decelerator at two sites for BRD4 only with relatively high concentrations of CDK9. For comparison, the positions of factor action from biochemical experiments are shown at the bottom. B, proposed mechanism of factor action based upon matching kinetically determined sites of factor action with known biochemical reactions of factors at different stages of induced gene transcription. The arrows do not necessarily represent a direct physical interaction between the two species. Rather, the arrows indicate the progression between different sites of action along the overall reaction sequence and may include several additional sites/steps that are not shown or known. With wtCDK9, 2–20-ng amounts of wtBRD4 function at two sites, whereas mtBRD4 acts at one site. However, with dnCDK9, both wtBRD4 and mtBRD4 (2–20 ng) have activity at just one site that is presumably the same as for wtCDK9 and mtBRD4. The positioning of wtBRD4 and mtBRD4 for concentrations of 2–20 ng reflects their sites of action being before or at the CLS. The split in the arrow from wt&mtBRD4 reflects that fact that the ordering of TIF2 and NELF-E, both of which are downstream of BRD4, has not been determined.

References

    1. Jensen E. V., and DeSombre E. R. (1972) Mechanism of action of the female sex hormones. Annu. Rev. Biochem. 41, 203–230 - PubMed
    1. Glass C. K., and Rosenfeld M. G. (2000) The coregulator exchange in transcription functions of nuclear receptors. Genes Dev. 14, 121–141 - PubMed
    1. McKenna N. J., and O'Malley B. W. (2002) Combinatorial control of gene expression by nuclear receptors and coregulators. Cell 108, 465–474 - PubMed
    1. York B., and O'Malley B. W. (2010) Steroid receptor coactivator (SRC) family: masters of systems biology. J. Biol. Chem. 285, 38743–38750 - PMC - PubMed
    1. Simons S. S., Jr. (2003) The importance of being varied in steroid receptor transactivation. Trends Pharmacol. Sci. 24, 253–259 - PubMed

Publication types

LinkOut - more resources